126: Exponential Regression
star
star
star
star
star
Last updated over 5 years ago
6 Nsɛmmisa
1
1
1
1
1
0
How do you enter data into the graphing calculator?
fill in L1 and L2
STAT
1: Edit
EDIT
How do you look at the graph?
2nd STATPLOT
9: ZoomStat
Plot1...On
ZOOM
How do you get the equation for the regression?
STAT
-> CALC
choose proper regression
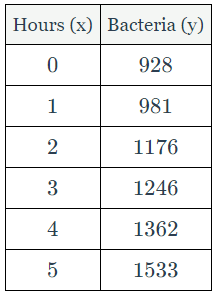
Write an exponential regression equation for this set of data, rounding all coefficients to the nearest hundredth.
Using this equation, determine the number of bacteria present after 14 hours, to the nearest whole number.
Choose all that are true