132: Logarithmic Regressions
star
star
star
star
star
Last updated over 5 years ago
6 Nsɛmmisa
1
1
1
1
1
0
How do you enter data into the graphing calculator?
EDIT
1: Edit
STAT
fill in L1 and L2
How do you look at the graph?
2nd STATPLOT
Plot1...On
ZOOM
9: ZoomStat
How do you get the equation for the regression?
STAT
-> CALC
choose proper regression
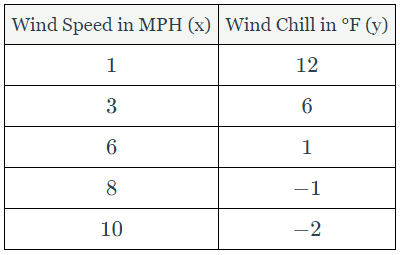
The accompanying table shows wind speed and the corresponding wind chill factor when the air temperature is 14°F. Write a logarithmic regression equation for this set of data, rounding all coefficients to the nearest ten-thousandth.
Using this equation, find the wind speed, to the nearest mile per hour, when the wind chill is -10°F.
Choose all that are true