5. 3.6 Analyzing Trend Lines
star
star
star
star
star
Posljednje ažuriranje over 5 years ago
11
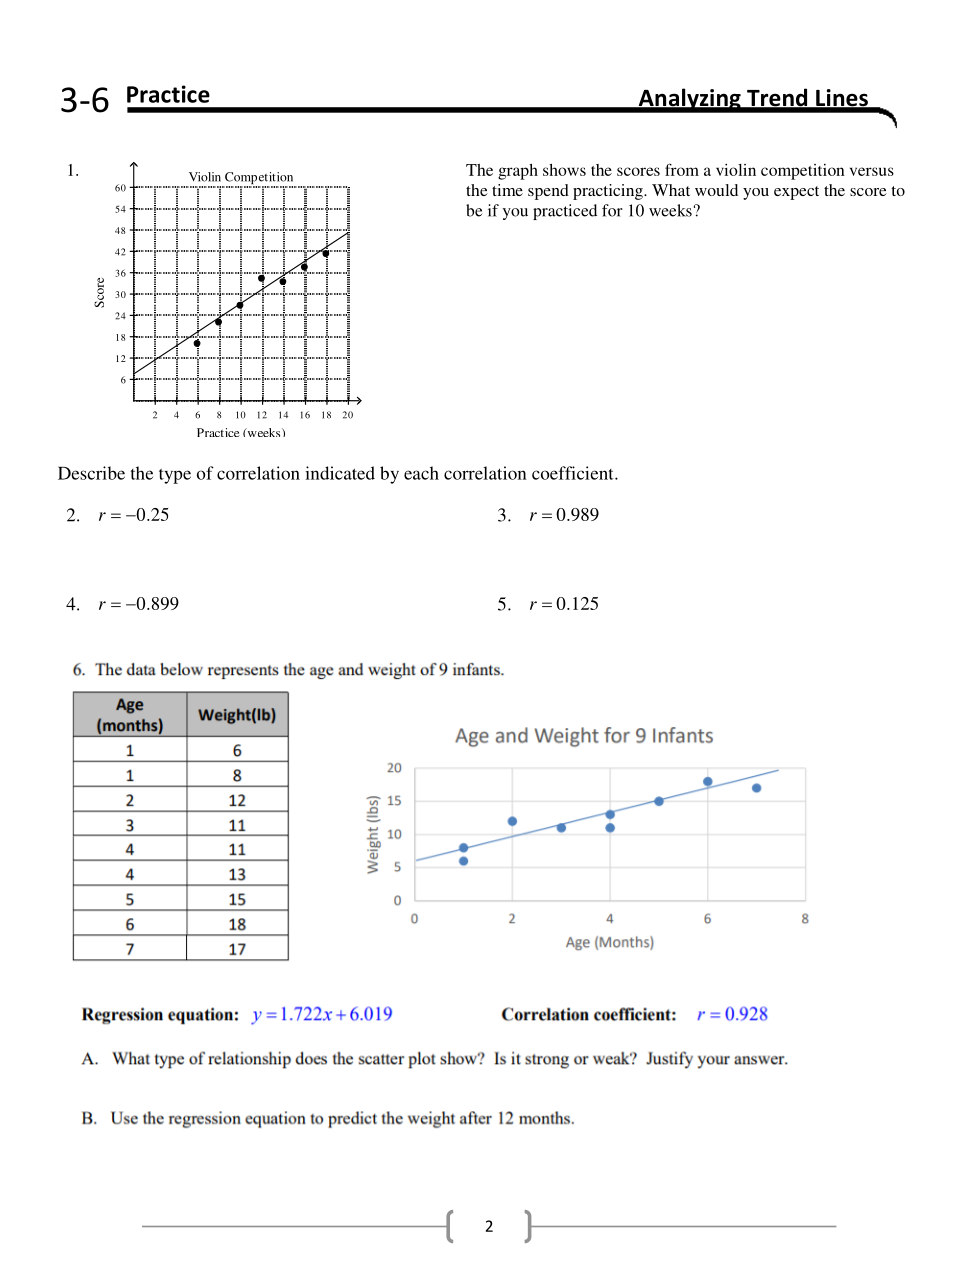
The graph shows the scores from a violin competition versus the time spend practicing. What would you expect the score to be if you practiced for 10 weeks?
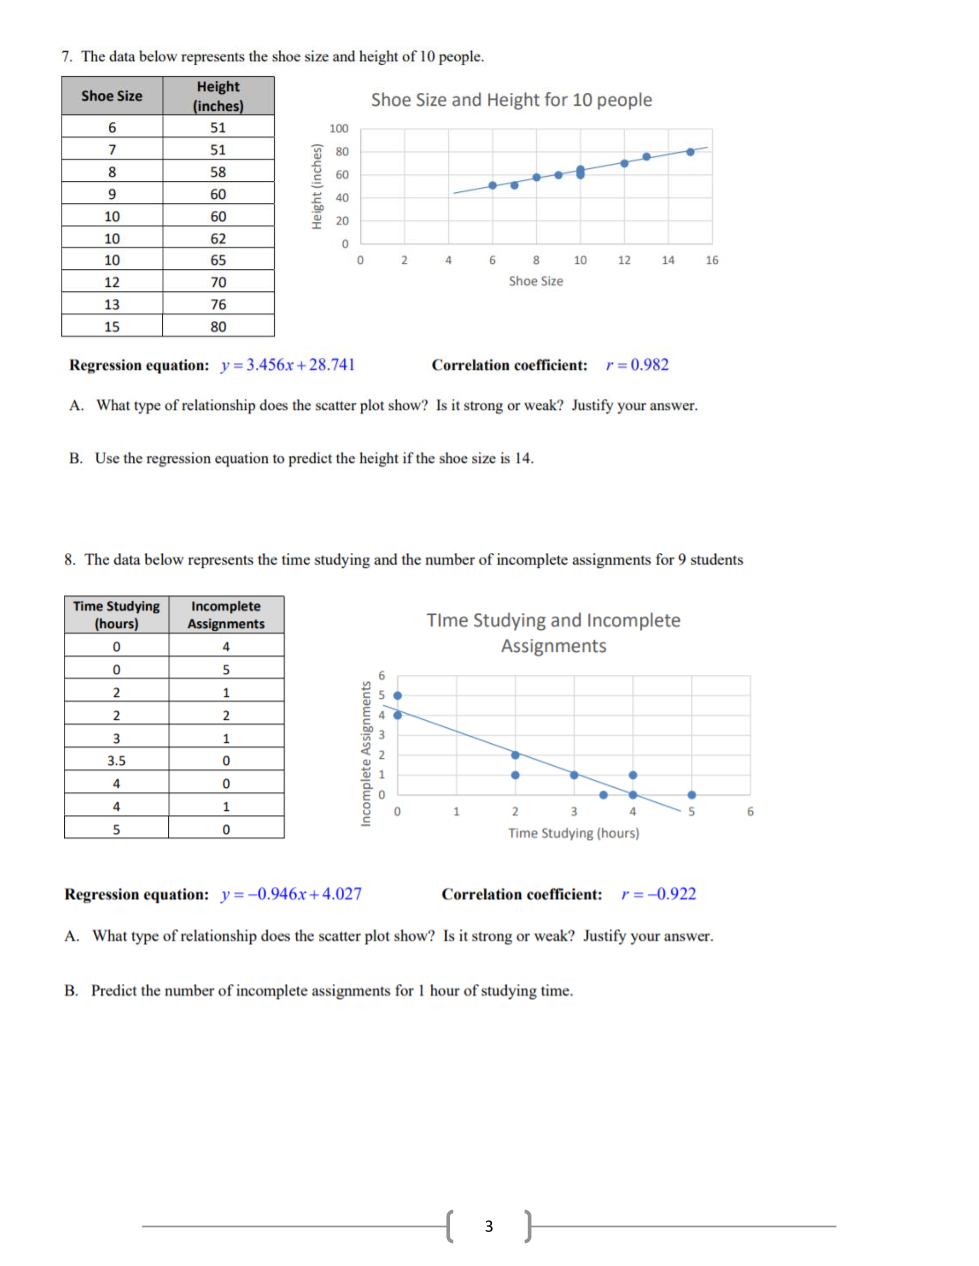
What type of relationship does the scatter plot show?
Use the regression equation to predict the height if the shoe size it 14.
What type of relationship does the scatter plot show?
Predict the number of incomplete assignments for 1 hour of studying time.
Describe the type of correlation indicated by each correlation coefficient.
Describe the type of correlation indicated by each correlation coefficient.
Describe the type of correlation indicated by each correlation coefficient.
Describe the type of correlation indicated by each correlation coefficient.
What type of relationship does the scatter plot show?
Use the regression equation to predict the weight after 12 months.