How are stars plotted on the H-R diagram?
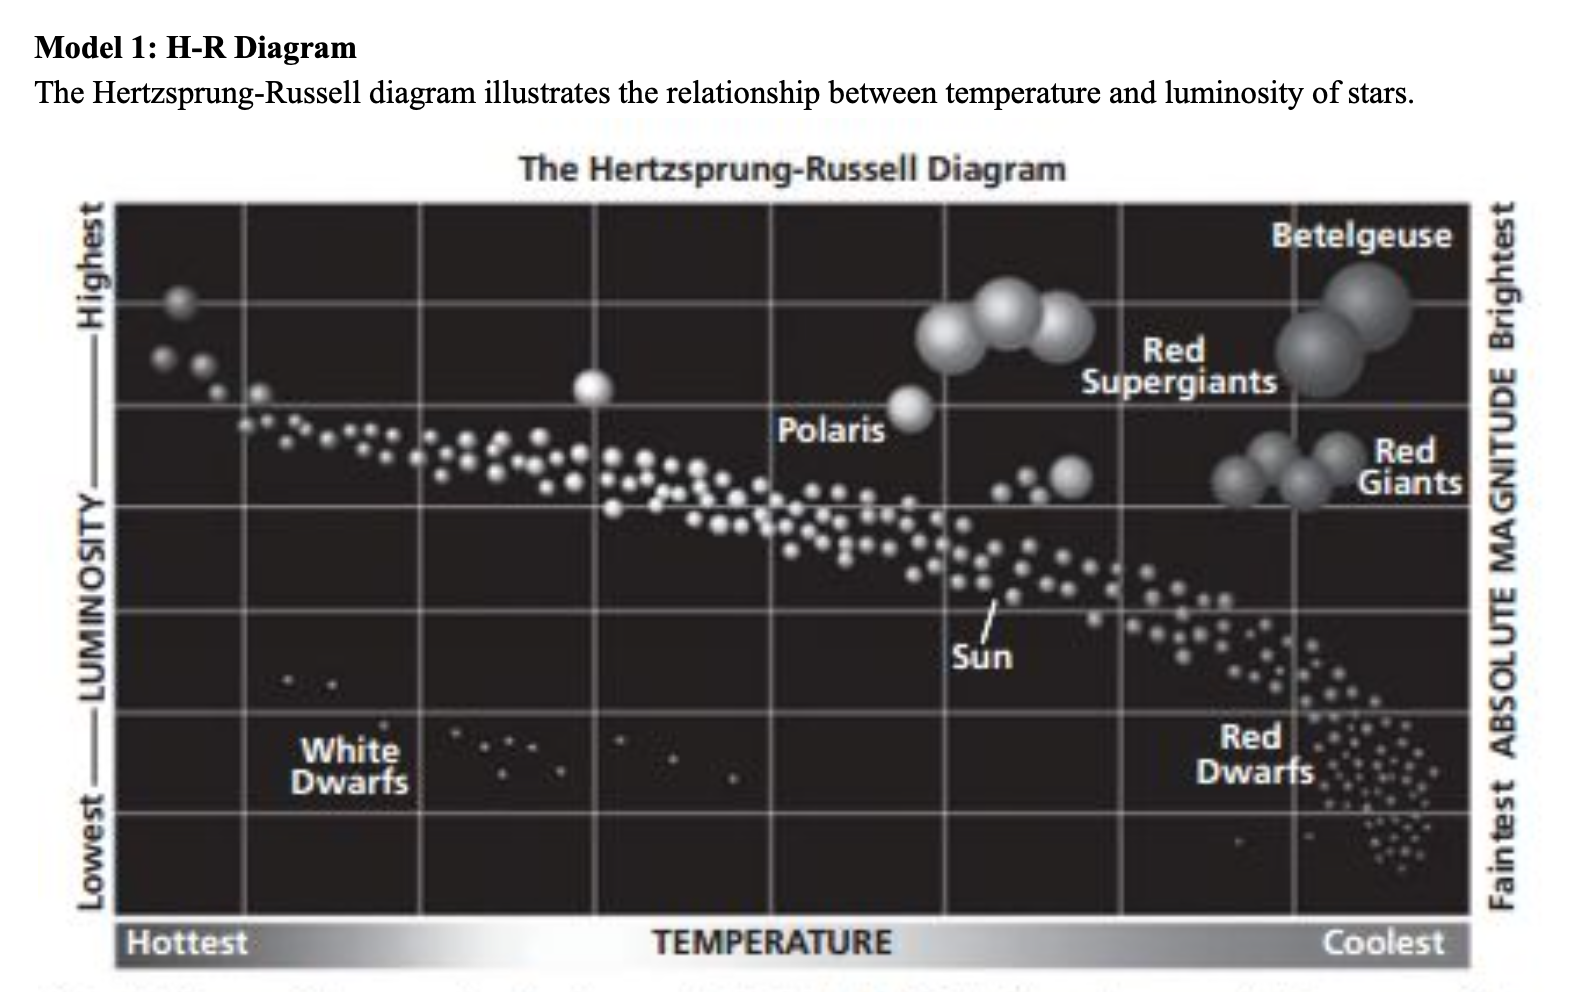
Astronomers refer to brightness as luminosity. Luminosity is actually a measure of the total amount of energy a star gives off each second. When the surface temperatures of stars are plotted against their luminosity, a consistent pattern is revealed. The graph that illustrates this pattern is called the Hertzsprung-Russell diagram, or H-R diagram.
The hottest stars are located on the left side of the H-R diagram and are blue. Stars become progressively cooler the farther to the right they are located on the diagram. The coolest stars are located on the right side of the diagram and are red. The brightest stars are located at the top of the diagram, and the dimmest stars are located at the bottom.