Match Graph PT and Motion Quiz - Hendryx
star
star
star
star
star
Posljednje ažuriranje over 5 years ago
25

1

1

1
1
1

1
1
1
1
1
2
2
2
2
1
1
1
1
2
1
10
In the graph above, between what two points is the object stopped?
In the graph above, between what points is the object traveling back towards the start?
In the graph above, between what points is the object traveling at a constant speed? (select all that apply)
In the graph above, between what points is the object traveling the fastest?
In the graph above, what are the units of speed?
Look at the arrow. How fast is the skateboard going from 0-15 seconds.
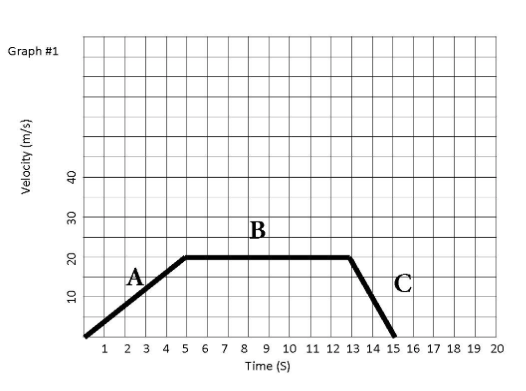
In the graph above describe the acceleration for segment A.
In the graph above describe the acceleration for segment B.
In the graph above describe the acceleration for segment C.
In the graph above, what velocity is the object traveling from 5 seconds - 13 seconds if the object is traveling west.
Draw a graph of something moving away from the reference point at a constant speed that is moving very slowly.
Draw a graph of something moving away from the reference point that is speeding up (accelerating).
Draw a graph of something moving toward the reference point at a constant speed that is moving very quickly.
Draw a graph of something not moving.
Speed is equal to...
Speed is different from velocity because...
The rate at which velocity changes is known as...
The Slope of a Distance vs. Time graph represents the...
A person walks 1 mile every day for exercise, leaving her front porch at 9:00 AM and returning to her front porch at 9:25 AM. What is the total displacement of her daily walk?
A horizontal line on a distance-time graph means the object is
What is the average speed of a bobsled whose distance-time graph indicates that it traveled 100 m in 25 s?