Log in
Sign up for FREE
arrow_back
Library

U2cL7 Scatterplot & Correlation Quiz

star
star
star
star
star
Last updated about 5 years ago
10 questions
1
1
1
1
1
1
Question 2
2.

What is the correlation coefficient(rounded to the nearest hundredth? What type of correlation? Separate with a comma

1
1
1
Question 6
6.

Which shows the line of best fit for the data?

Question 7
7.

Use the equation to help him predict the number of students who will drop out in 2012?

Question 8
8.

Which graph respresents a positive correlation?

Question 9
9.

Using the line of best fit, predict the average consumption of bottled water in the year 2000?

1
Question 10
10.

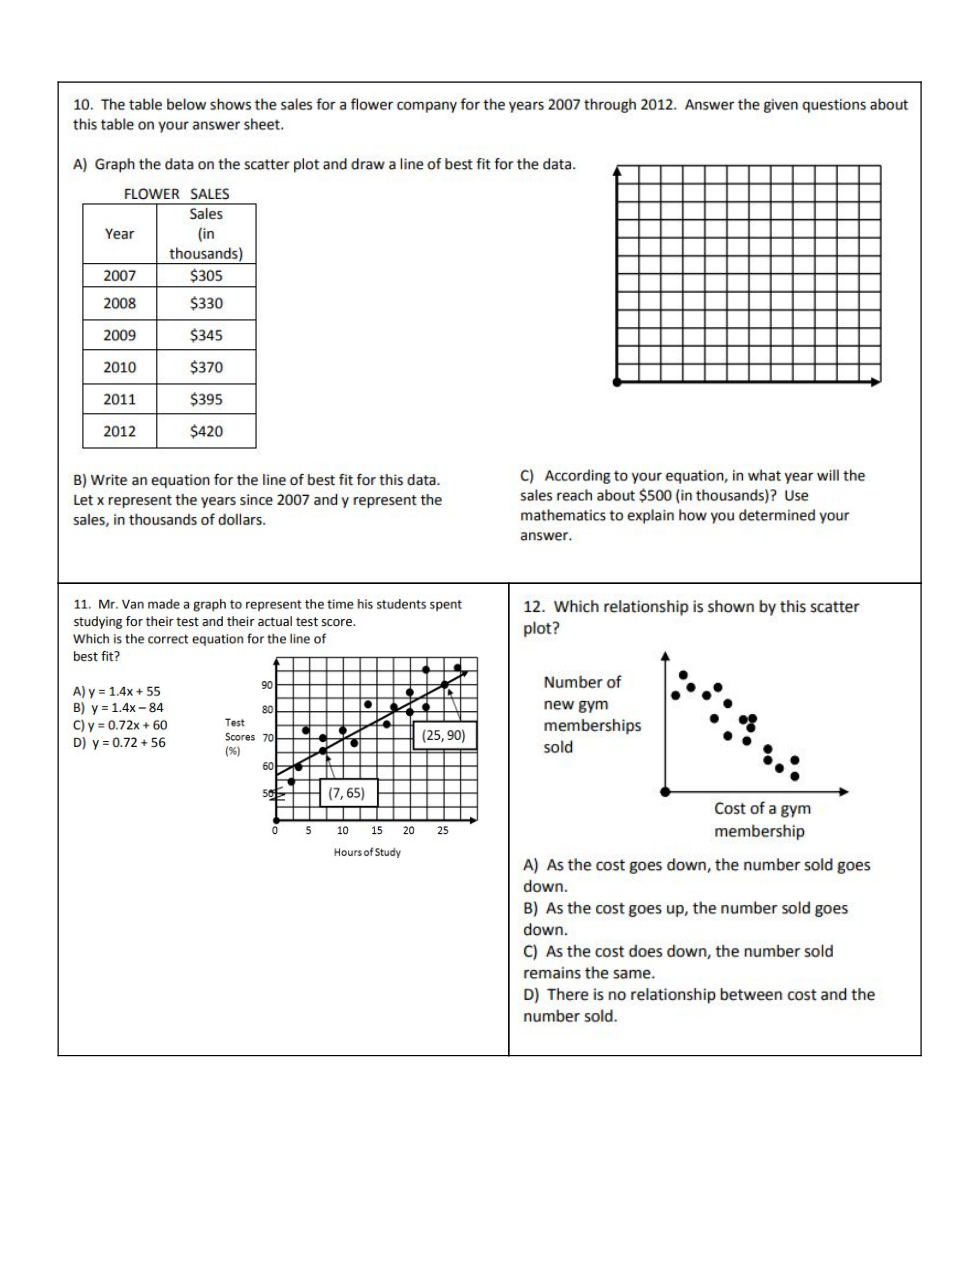
Write your equation for the line of best fit(round to the nearest hundredth and no spaces). Then write your prediction for in what year sales will reach $500. Separate your responses with a comma

Question 1
1.

How many hits should you expect from a player who is at bat 175 times?

Question 3
3.

If he uses the points (2, 8) and (5, 1.5) from his line, which equation ould best represent the line of best fit?

Question 4
4.

Which of the two given points would be the best to use to calculate the line of best fit?

Question 5
5.

Which is most likely the relationship he will see between age and height?