1
1
1
1
2
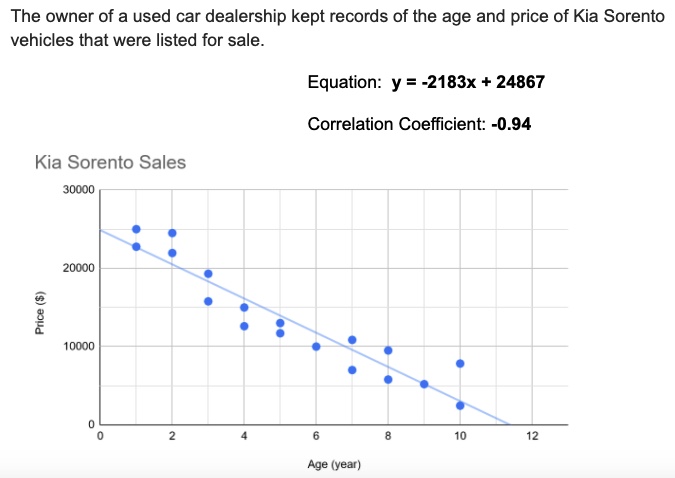
Using the equation, predict the age of a Kia Sorento if the cost was $20,501.
Using the equation, predict the age of a Kia Sorento if the cost was $20,501.
2
Write an equation for a line going through the following two points.
(0, -4) and (10, 8)
Write an equation for a line going through the following two points.
(-8, 3) and (0, 1)
Using the equation, predict the age of a Kia Sorento if the cost was $20,501.
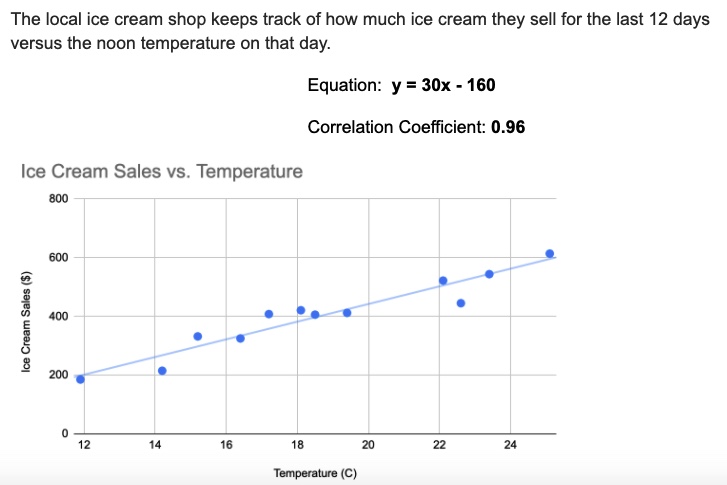
Using the equation, predict how much the ice cream sales would be if the temperature was 30 degrees.
Match the independent and dependent variables.
| Stavka koja se može prevući | arrow_right_alt | Odgovarajuća stavka |
|---|---|---|
Dependent Variable (y) | arrow_right_alt | Hours of Study |
Independent Variable (x) | arrow_right_alt | Exam Scores |
The independent variable (x) is
The dependent variable (y) is
What is the slope?
What is the y-intercept?
Using the equation, predict the price of a Kia Sorento if it were 5.5 years old.
The independent variable (x) is
the dependent variable (y) is
What is the slope of the line?
What is the y-intercept?
Using the equation, predict the temperature if the ice creams sales were $470.
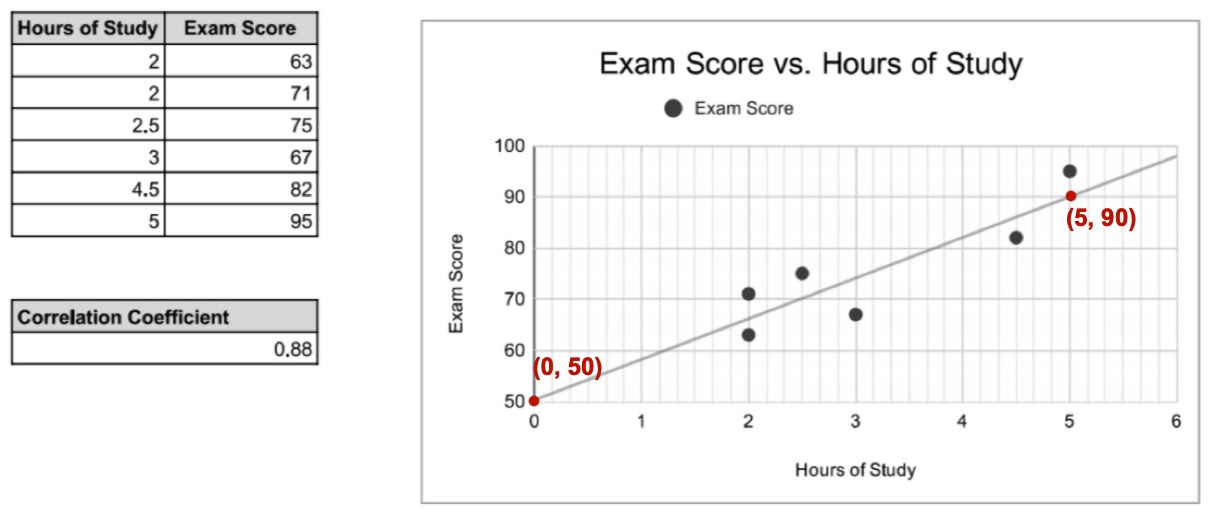
Using the given points on the graph, write an equation to represent the relationship.
Using the graph, estimate the exam score if a student studies 3.5 hours.
Using the graph, estimate the amount of hours a student studied if they scored 70%