1
What is the explanatory variable (what two groups are being compared)?
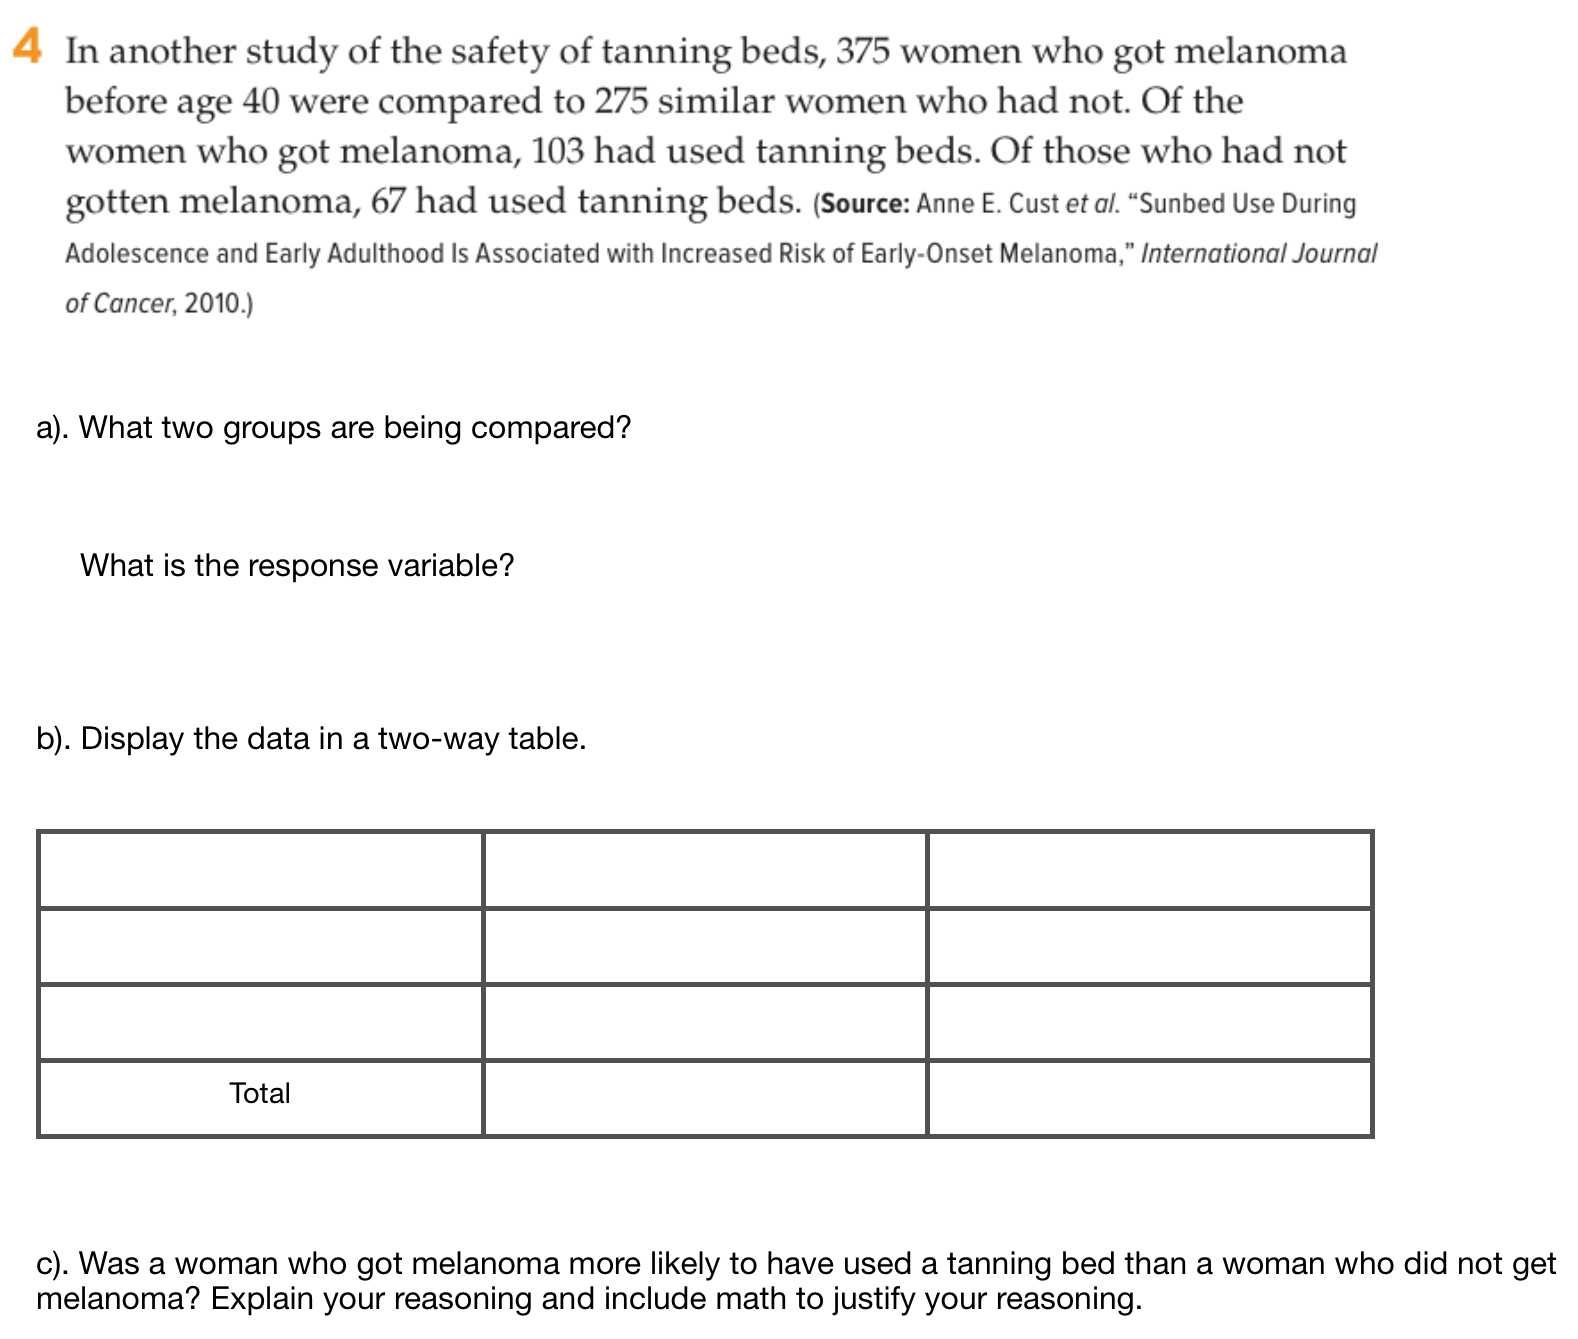
What is the explanatory variable (what two groups are being compared)?
1
What is the response variable?
What is the response variable?
5
Display the data in a two-way frequency table.
Display the data in a two-way frequency table.
2
Was a woman who got melanoma more likely to have used a tanning bed than a woman who did not get melanoma? Explain your reasoning.
Was a woman who got melanoma more likely to have used a tanning bed than a woman who did not get melanoma? Explain your reasoning.


