TOOLKIT Notes: Interpreting Categorical Data
star
star
star
star
star
Posljednje ažuriranje over 5 years ago
41
_____ that can be
_____ by
_____ the
_____ of
_____ in the
_____ of
_____ that fall into each of a
_____ of
_____
(_____) categories.
The _____ or
_____ of people in the
_____ of
_____ for whom an
_____ _____ occurs.
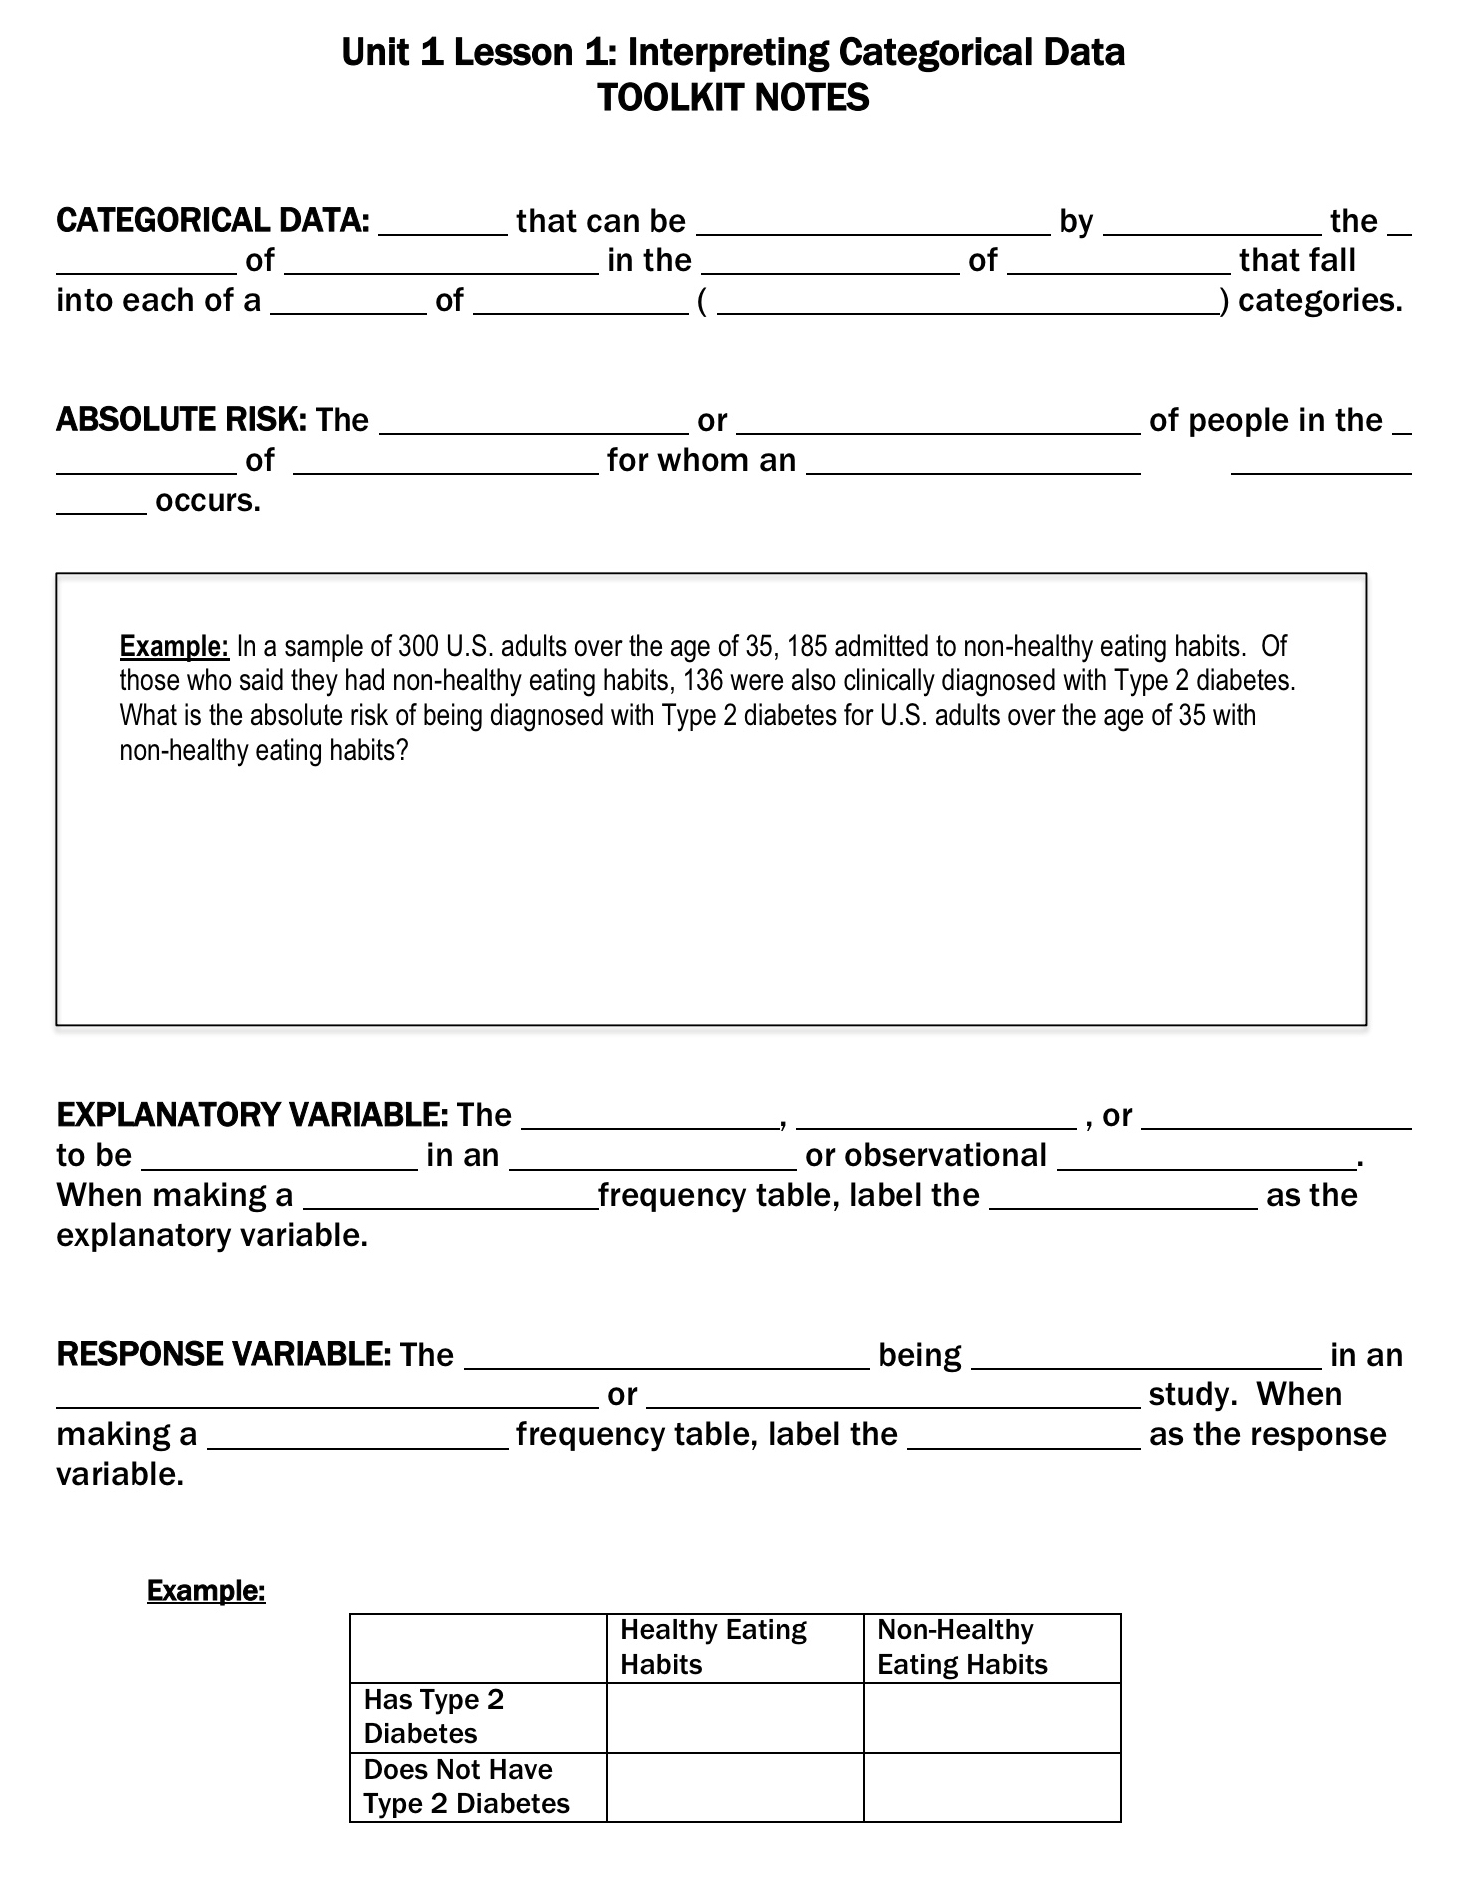
Example: In a sample of 300 U.S. adults over the age of 35, 185 admitted to non-healthy eating habits. Of those who said they had non-healthy eating habits, 136 were also clinically diagnosed with Type 2 diabetes. What is the absolute risk of being diagnosed with Type 2 diabetes for U.S. adults over the age of 35 with non-healthy eating habits?
The _____,
_____ ,
or _____ to be
_____ in an
_____ or observational
_____ .
When making a _____ frequency table,
label the _____ as the explanatory variable.
The _____ being
_____ in an
_____ or
_____ study.
When making a _____ frequency table,
label the _____ as the response variable.
Example: illustrate on the table where to locate the explanatory and response variables when comparing risk in a two-way frequency table.
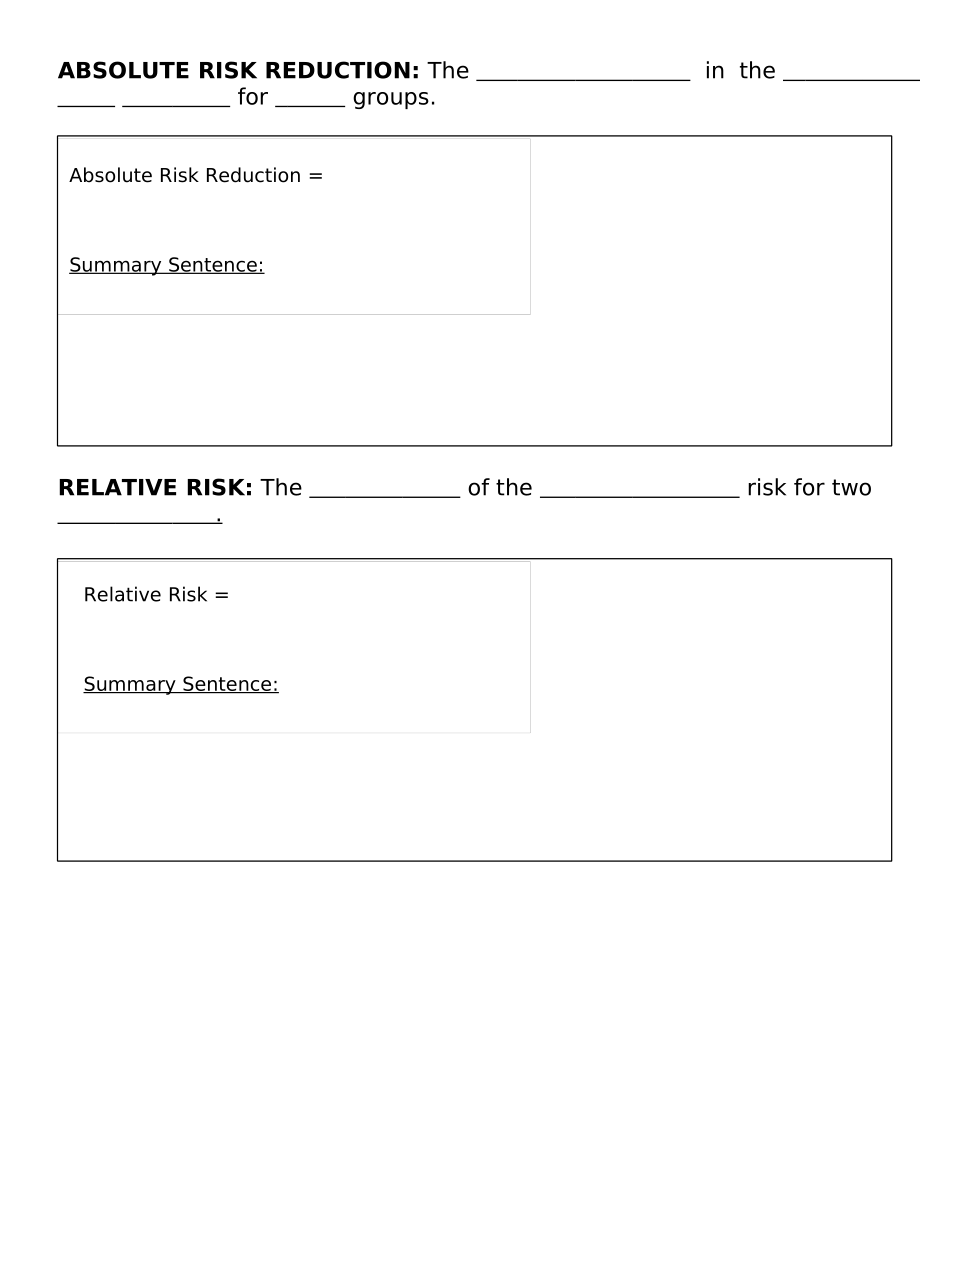
The _____ in the
_____ _____ for
_____ groups.
Absolute Risk Reduction =
Summary Sentence for Absolute Risk Reduction:
The _____ of the
_____ risk for two
_____ .
Relative Risk =
Summary Sentence for Relative Risk: