Unit 4 Review
star
star
star
star
star
Last updated about 2 years ago
25 Nsɛmmisa
1
1
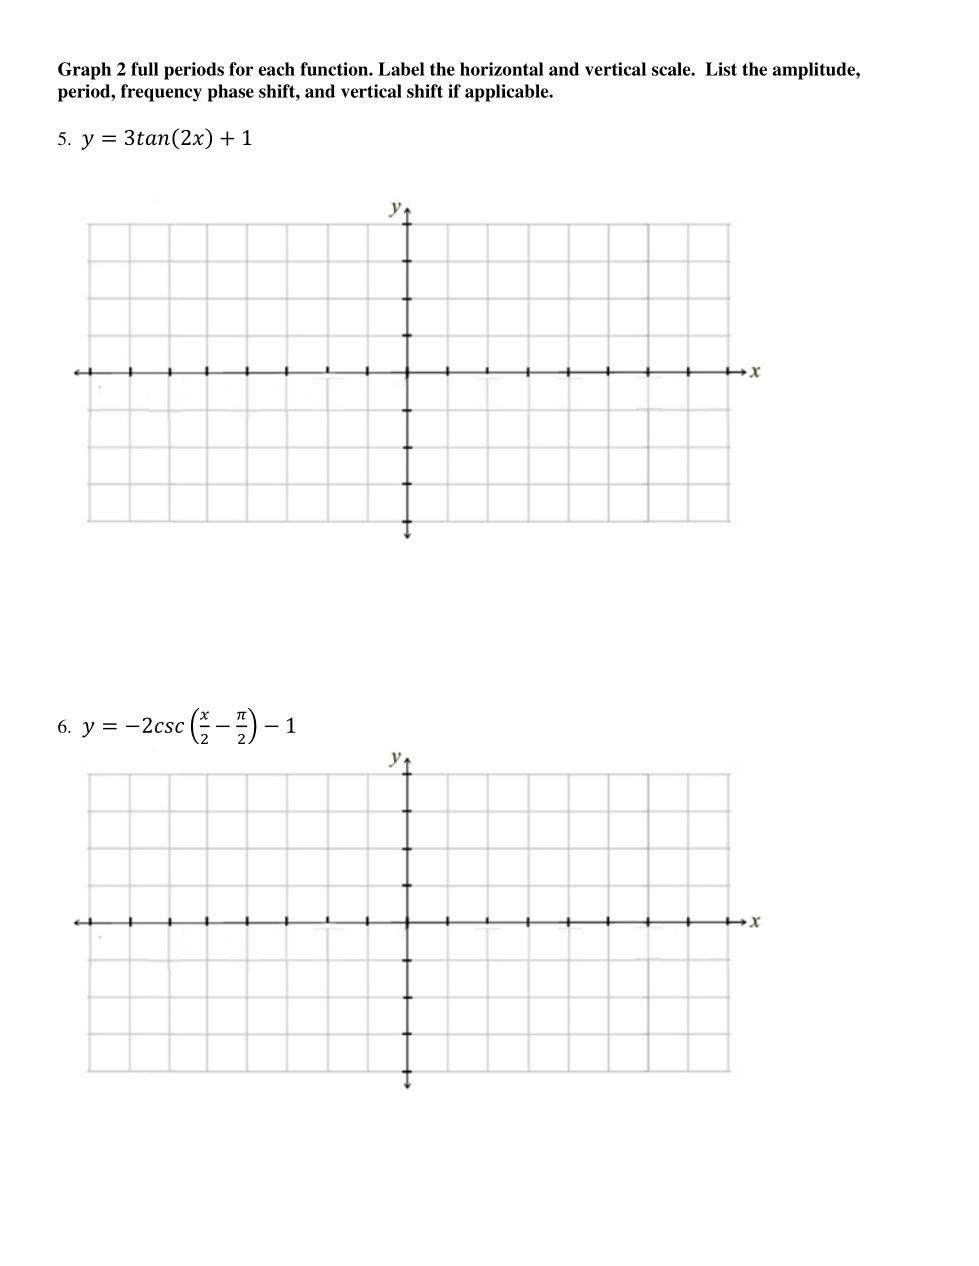
Graph 2 full periods for the function. Label the horizontal and vertical scales. List the amplitude, period, frequency , phase shift, and vertical shift, if applicable. Graph the midline for any vertical shift and the asymptotes for one period as dashed lines.
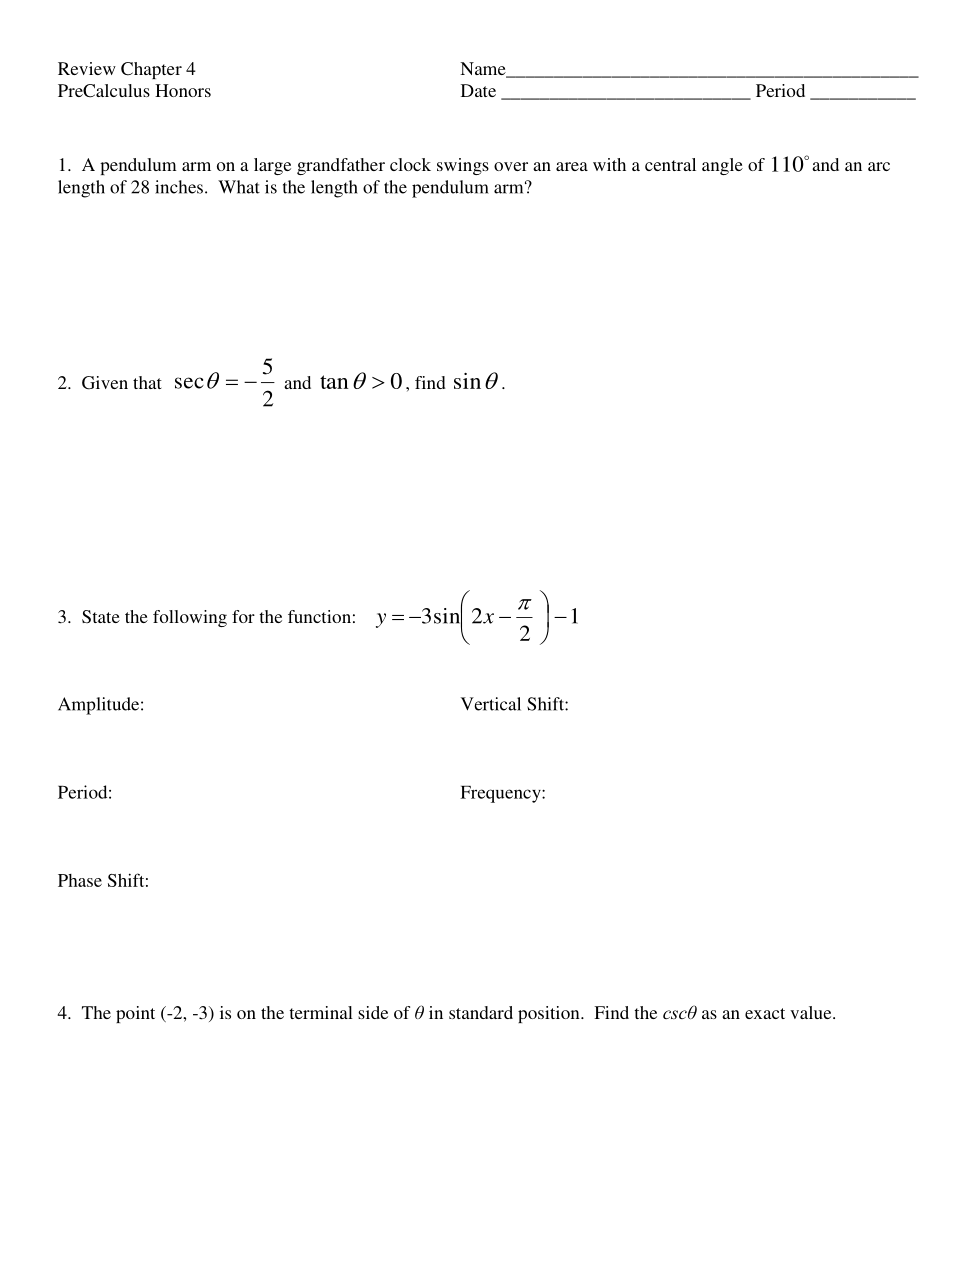
Graph 2 full periods for the function. Label the horizontal and vertical scales. List the amplitude, period, frequency , phase shift, and vertical shift, if applicable. Graph the midline for any vertical shift and the asymptotes for one period as dashed lines.
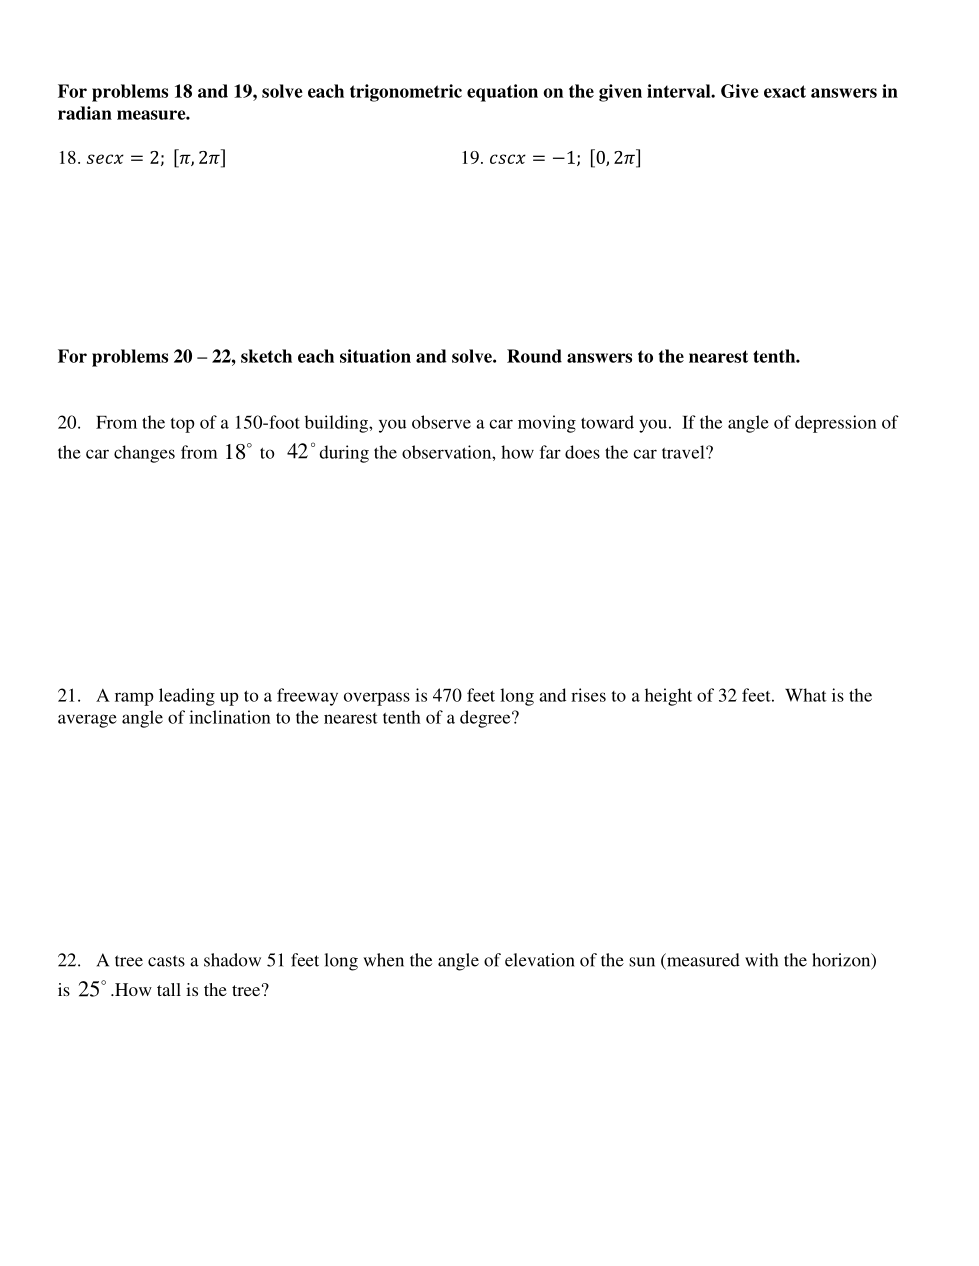
Solve the for x on the given interval. Give exact answers in radian measure.
Solve the for x on the given interval. Give exact answers in radian measure.
From the top of a 150-foot building, you observe a car moving toward you. If the angle of depression of the car changes from 18 degrees to 42 degrees during the observation, how far does the car travel? Round your final answer to the nearest foot.
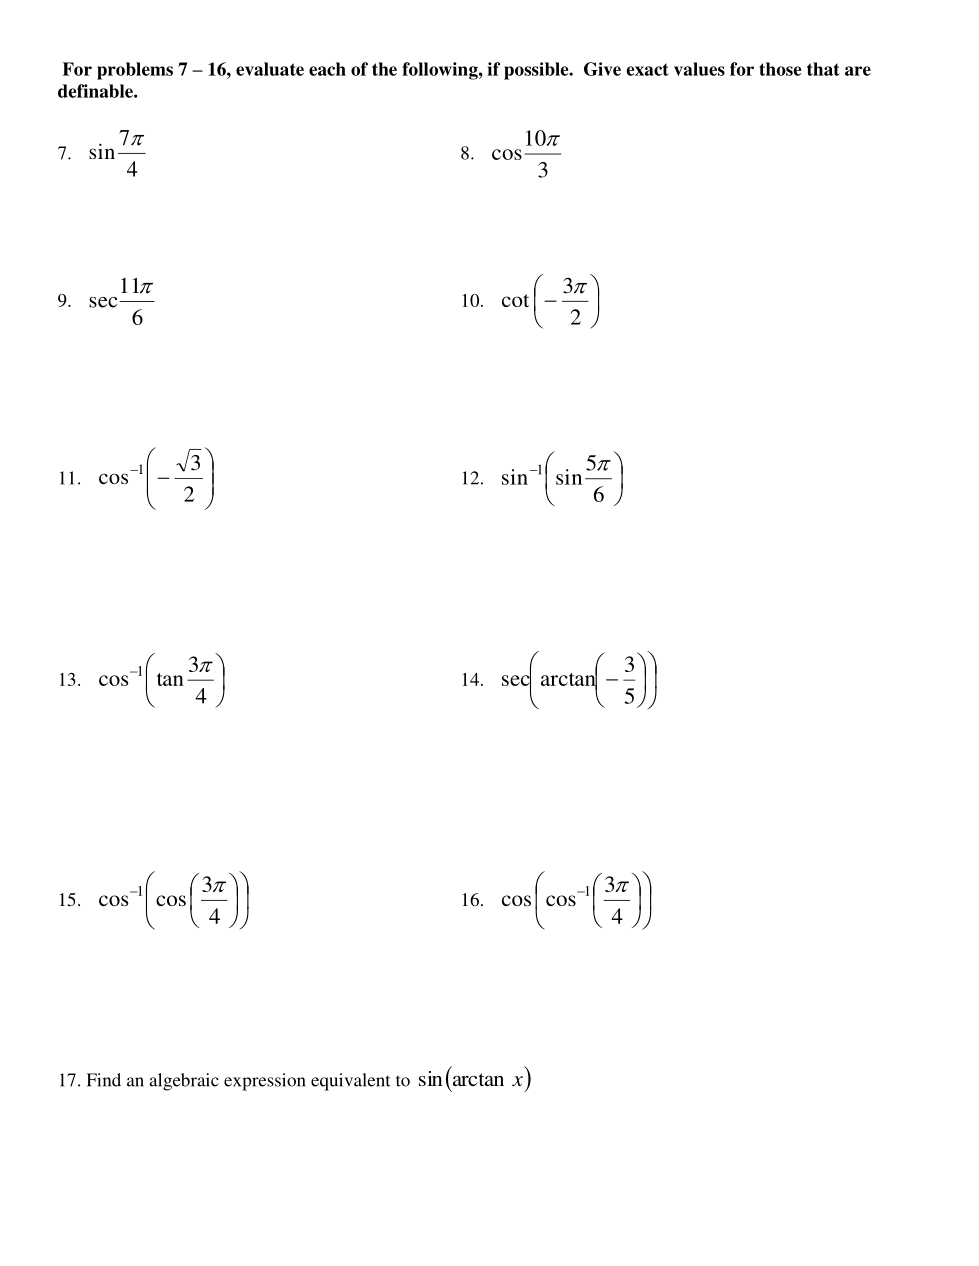
What is the length of the pendulum arm to the nearest tenth of an inch?
Find the sine of theta as an exact value only.
State the amplitude of the given sine function.
Describe the vertical shift of the given sine function.
State the period of the given sine function.
Describe the frequency of the given sine function.
Describe the phase shift of the given sine function.
The point (-2, -3) is on the terminal side of theta in standard position. Find the cosecant of theta as an exact value only.
Give the exact value, if it is definable. Rationalize any denominator with a square root.
Give the exact value, if it is definable. Rationalize any denominator with a square root.
Give the exact value, if it is definable. Rationalize any denominator with a square root.
Give the exact value, if it is definable. Rationalize any denominator with a square root.
Give the exact value, if it is definable. Report your answer in radians.
Give the exact value, if it is definable. Report your answer in radians.
Give the exact value, if it is definable. Report your answer in radians.
Give the exact value, if it is definable. Rationalize any denominator with a square root.
Give the exact value, if it is definable. Report your answer in radians.
Give the exact value, if it is definable. Report your answer in radians.
A ramp leading up to a freeway overpass is 470 feet long and rises to a height of 32 feet. What is the average angle of inclination to the nearest tenth of a degree?
A tree casts a shadow 51 feet long when the angle of elevation of the sun (measured with the horizon) is 25 degrees. How tall is the tree to the nearest tenth of a foot?