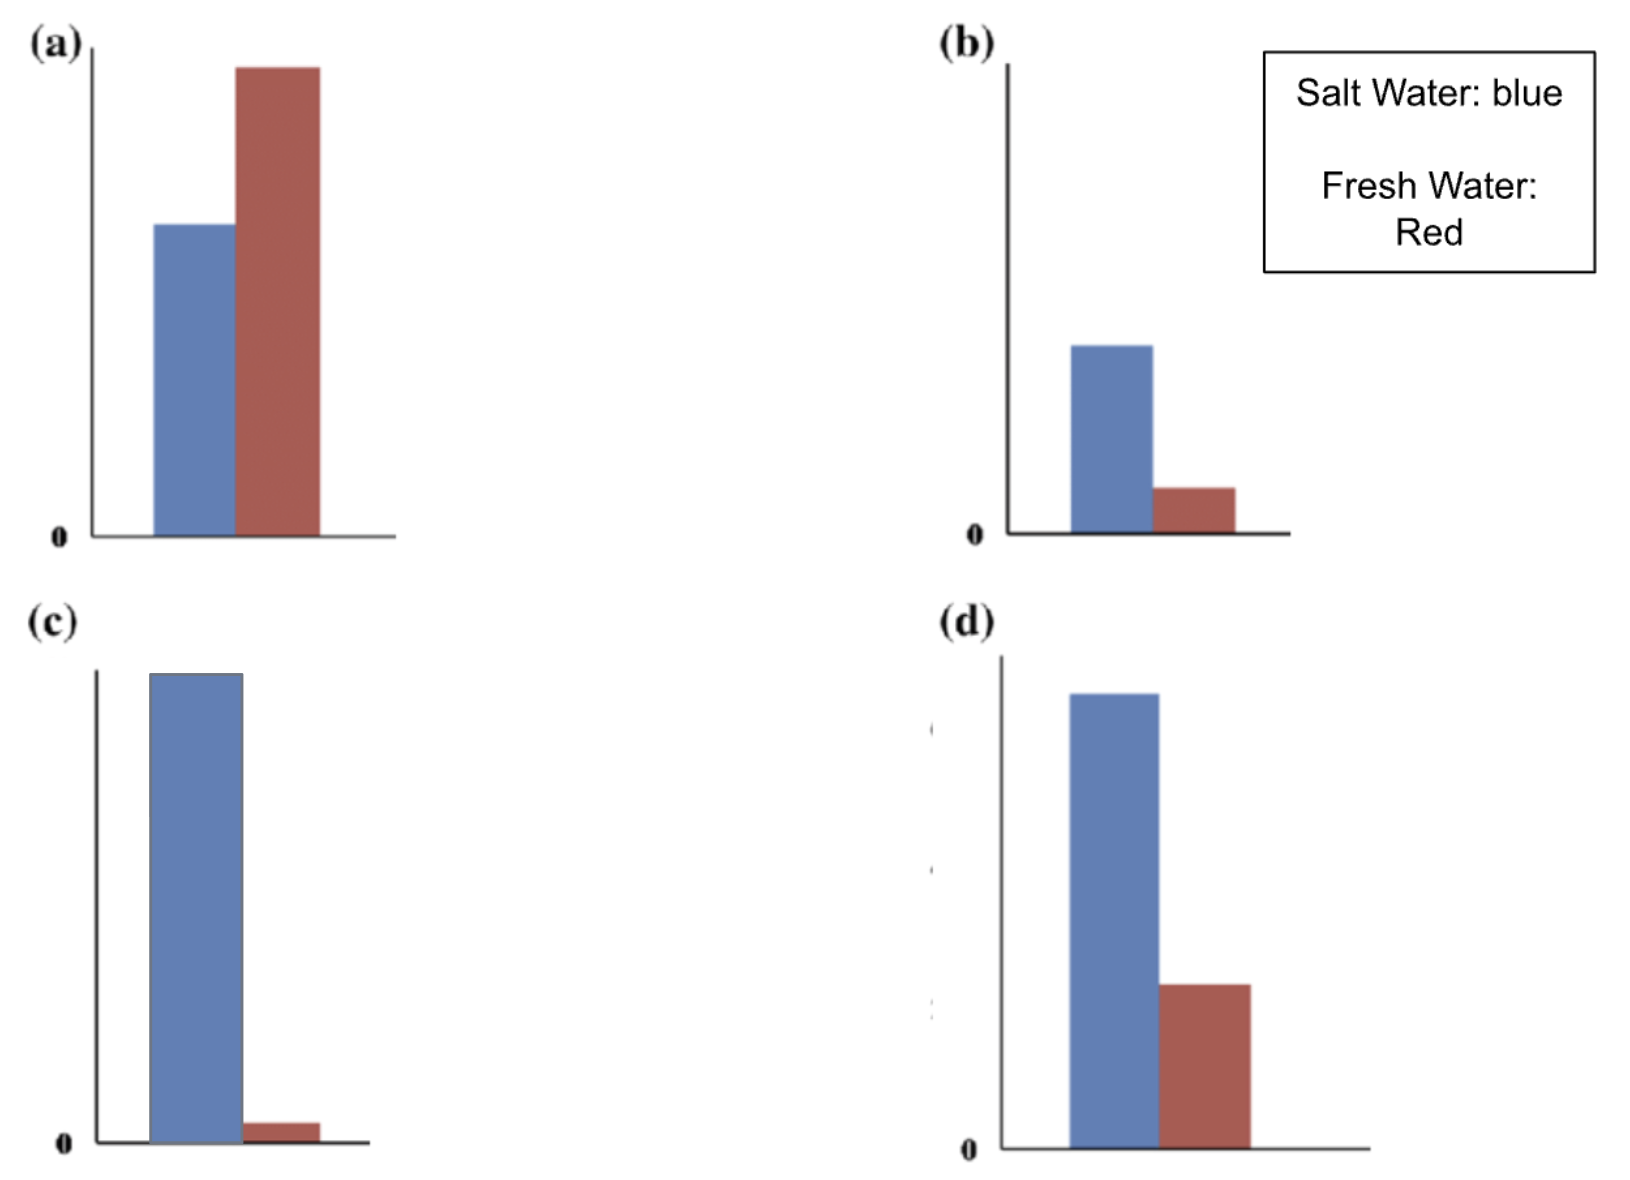
Explain why you chose that graph.
Which graph accurately shows the amount of salt water versus fresh water on Earth?
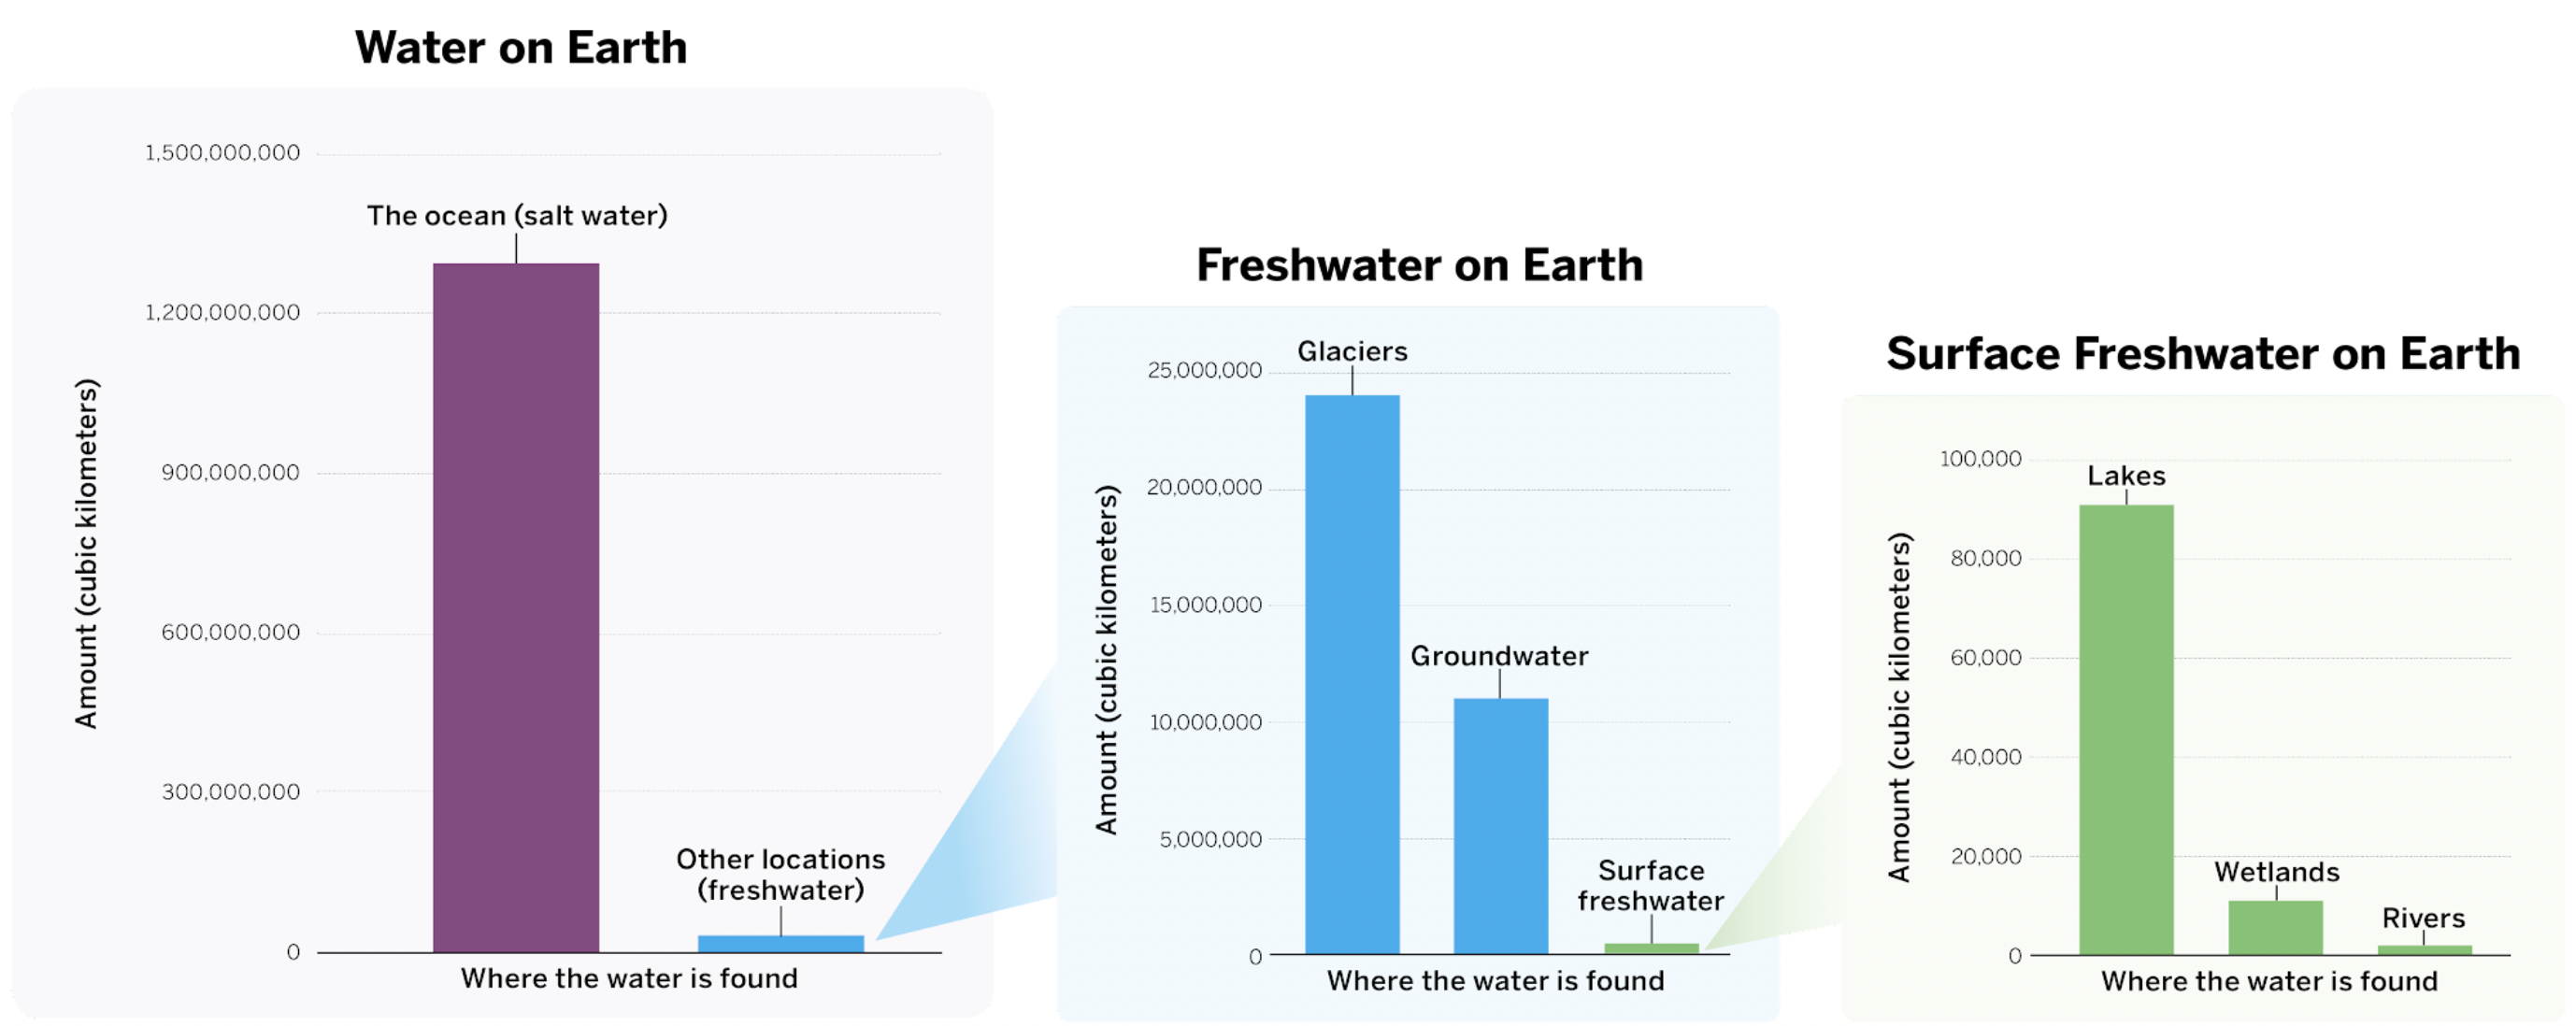
A student says there is the most freshwater in lakes and rivers. Do you agree or disagree? Explain your answer
Where can we find freshwater on Earth?
Molecules Model

Which model has the highest temperature?
If heat is added to Example B, which model would best show how the molecules are moving? Explain.
If Example C is cooled, which model would best show how the molecules are moving now? Explain

Criteria For Success:
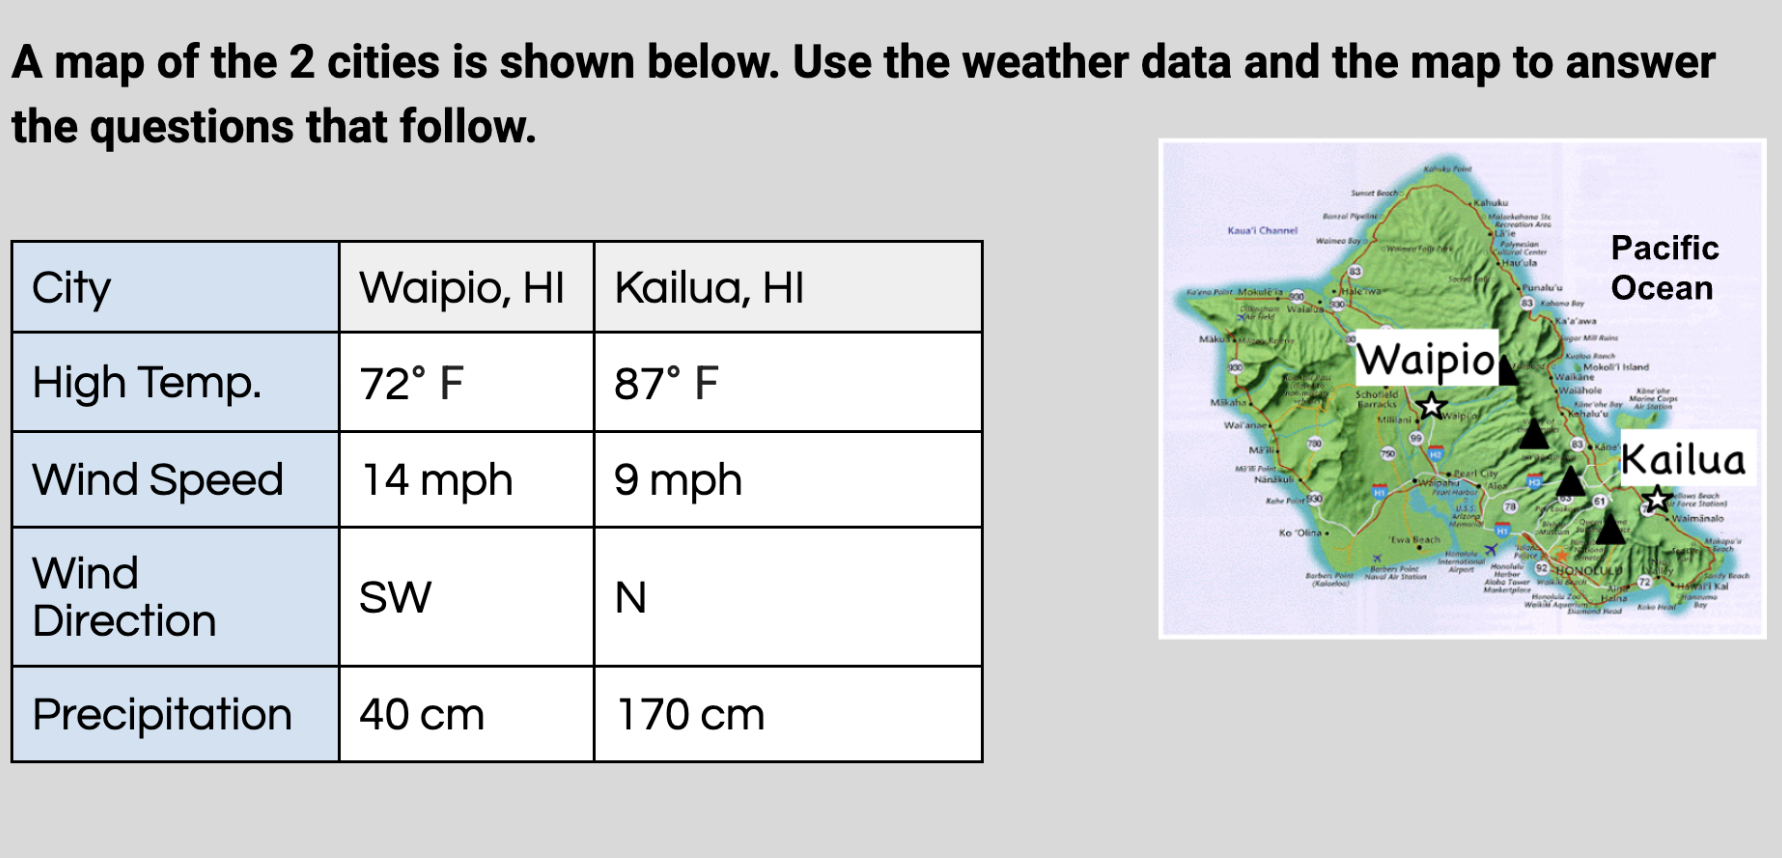
Determine which city is near a body of water
Identify the temperature of that city
Determine if that city would have the most water moving into the atmosphere.
Explain why city would have the most water moving into the atmosphere.
In which city would you expect to see the most liquid water moving into the atmosphere during the day? Why?
______________ would have the most liquid water moving into the atmosphere.
In the data table, it shows ____________.
On the map, it shows ____________.
Explain the phase change that causes liquid water to move up the atmosphere.


Criteria For Success:
Claim: Explain why it rains more on West Ferris
Evidence: Use evidence from the sim to support your claim.
Reasoning:
Explain the phase change that forms raindrops
Explain how raindrops form
Identify where the water for raindrops comes from
Identify the amount needed
Identify the temperature
Identify the phase change that forms raindrops
Why does it rain more in West Ferris?
Write a CER paragraph. Use evidence from the picture of the sim:
It rains more on West Ferris because ___________
In the simulation, it shows ________
________ is (Explain the phase change that forms raindrops)
Raindrops form when ________
Which model has the lowest temperature?