Log in
Sign up for FREE
arrow_back
Library
Interpreting Box and Whisker Plots
By Stephanie Finn
star
star
star
star
star
Share
share
Last updated about 5 years ago
21 questions
Add this activity
zoom_in
zoom_in
1
2
3
4
5
7
8
6
zoom_in
1
1
1
1
1
1
1
1
9
10
11
12
13
14
zoom_in
1
Question 9
9.
1
Question 10
10.
1
1
1
1
15
16
17
18
19
20
21
zoom_in
1
1
1
1
1
1
1
Question 1
1.
Question 2
2.
Question 3
3.
Question 4
4.
Question 5
5.
Do you think the test was too hard for students? EXPLAIN!
Question 6
6.
Would you expect the mean to be above or below the median?
Question 7
7.
Question 8
8.
Question 11
11.
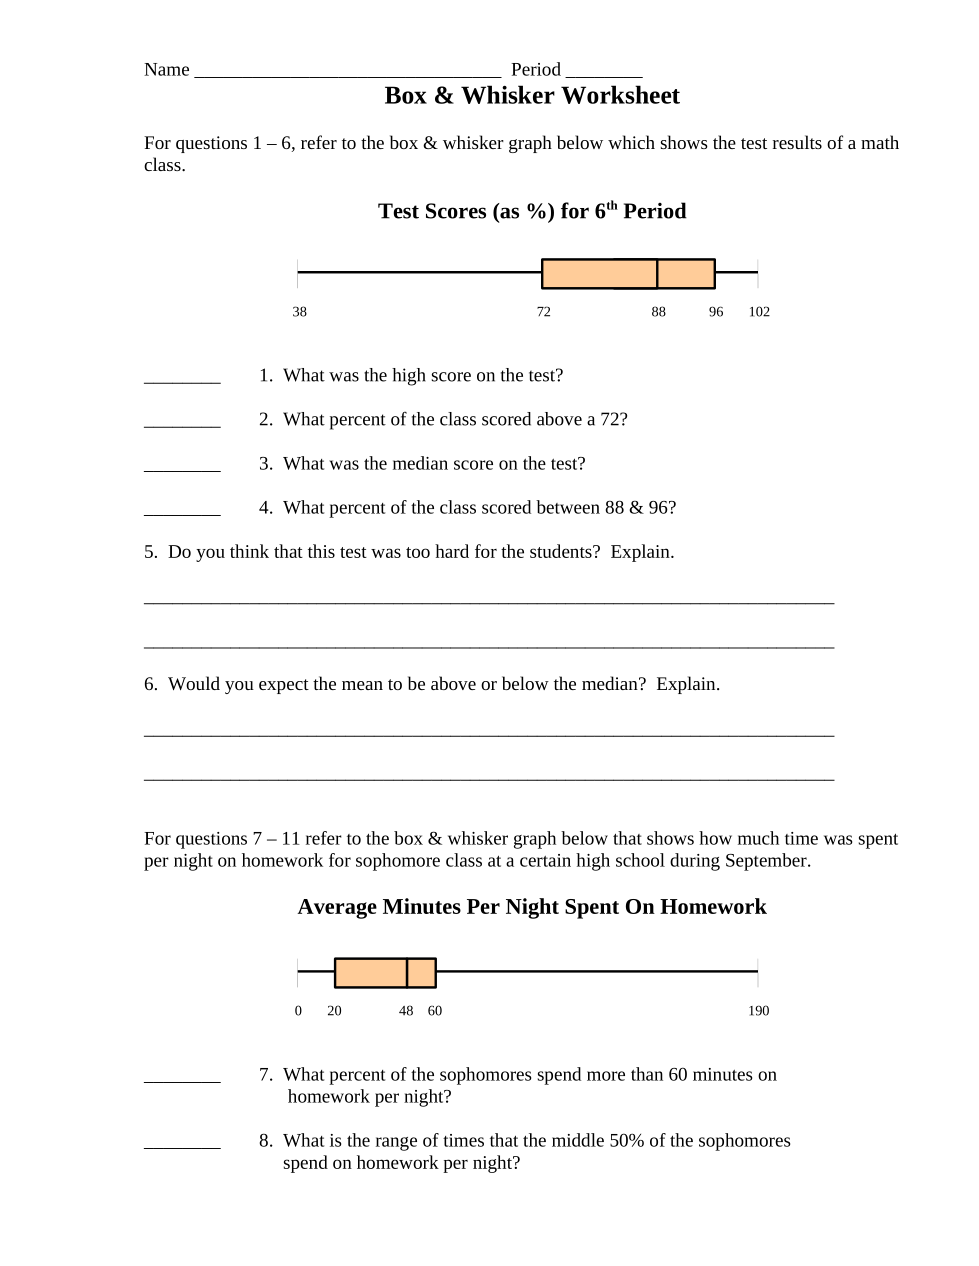
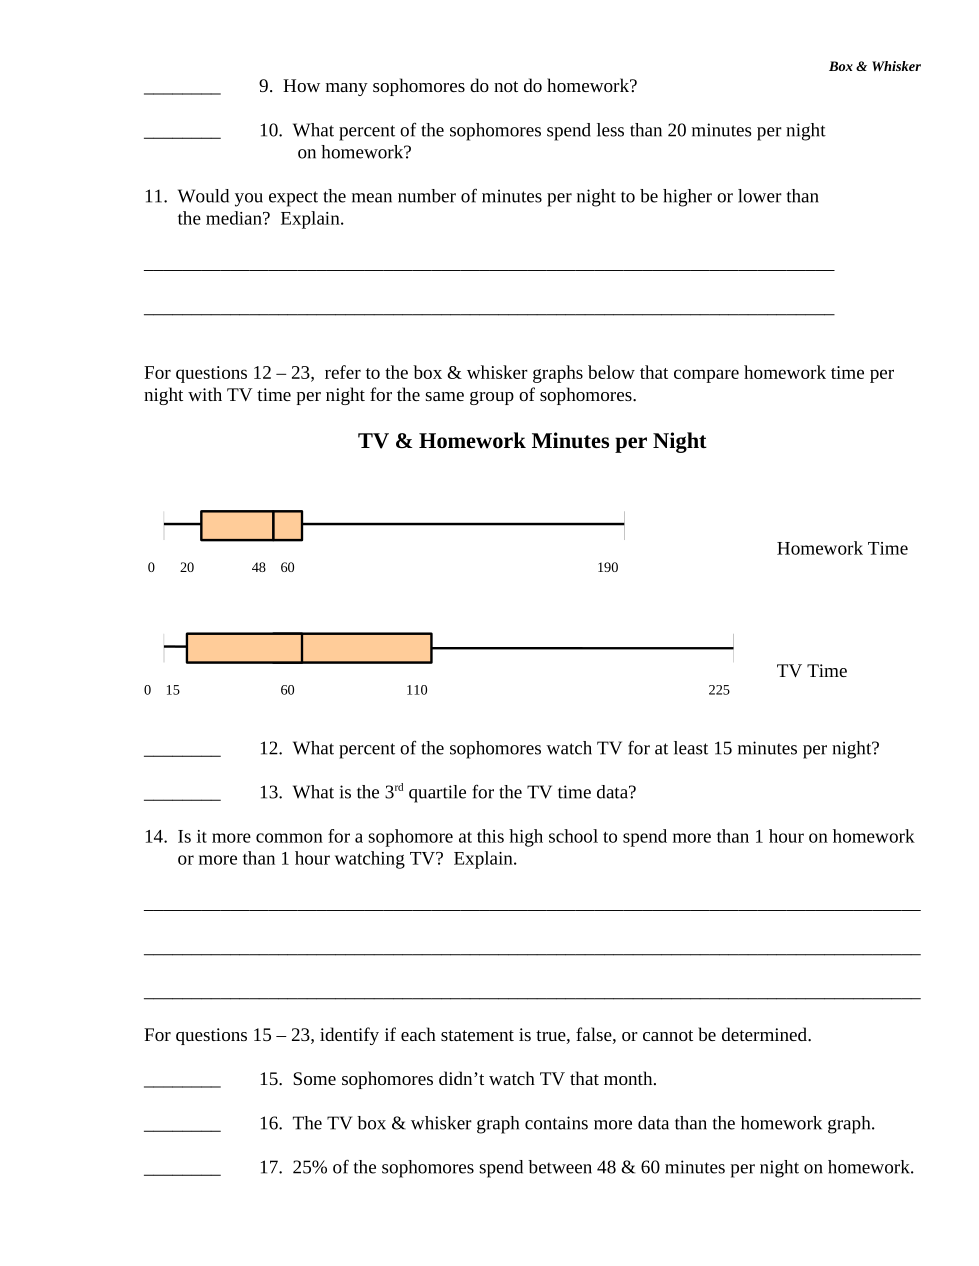
Be sure to explain! Cite your evidence from the box plot.
Question 12
12.
True
Question 13
13.
True
Question 14
14.
True
Question 15
15.
True
Question 16
16.
True
Question 17
17.
True
Question 18
18.
True
Question 19
19.
True
Question 20
20.
True
Question 21
21.
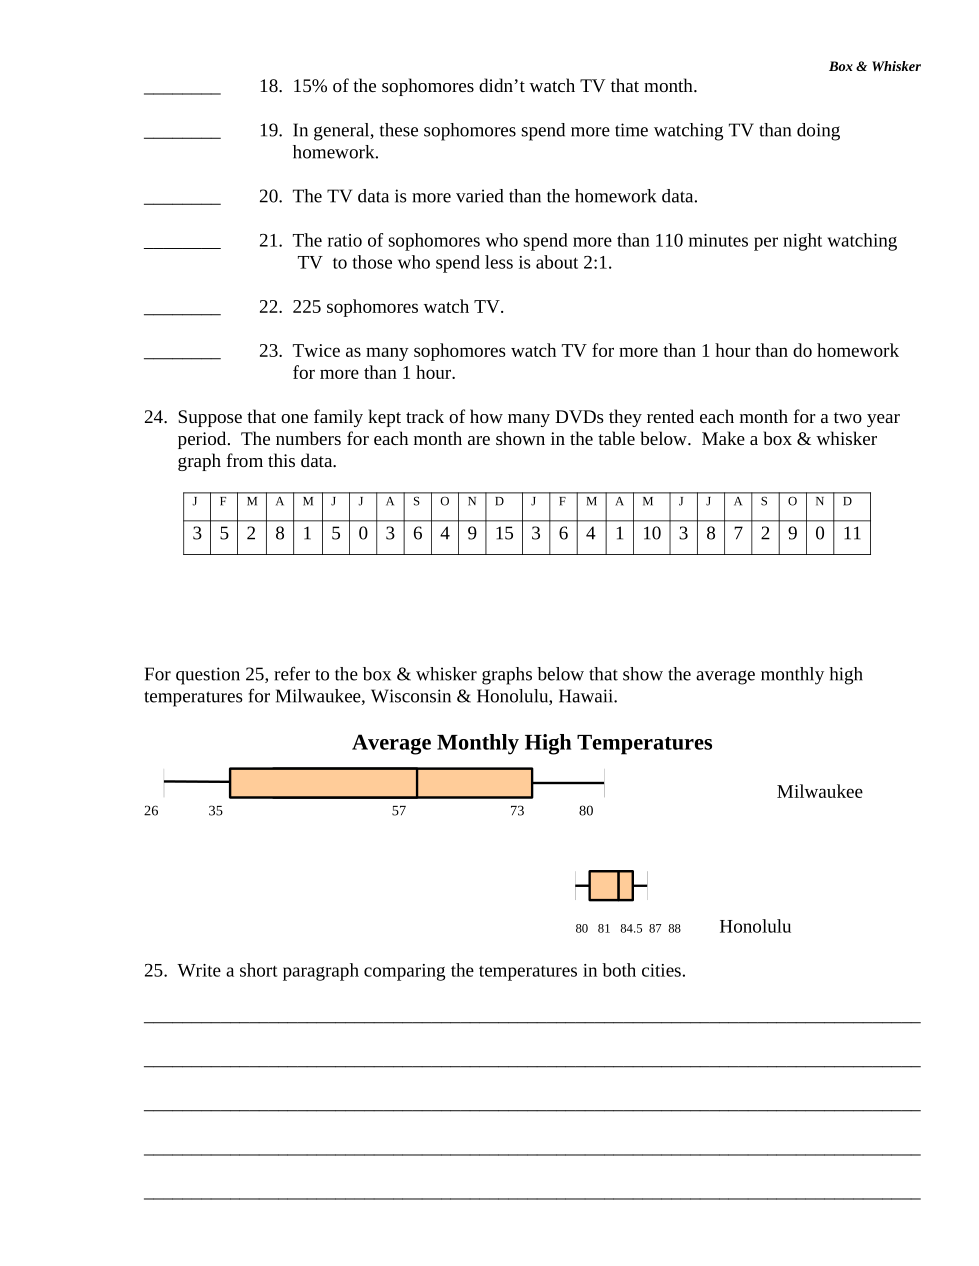
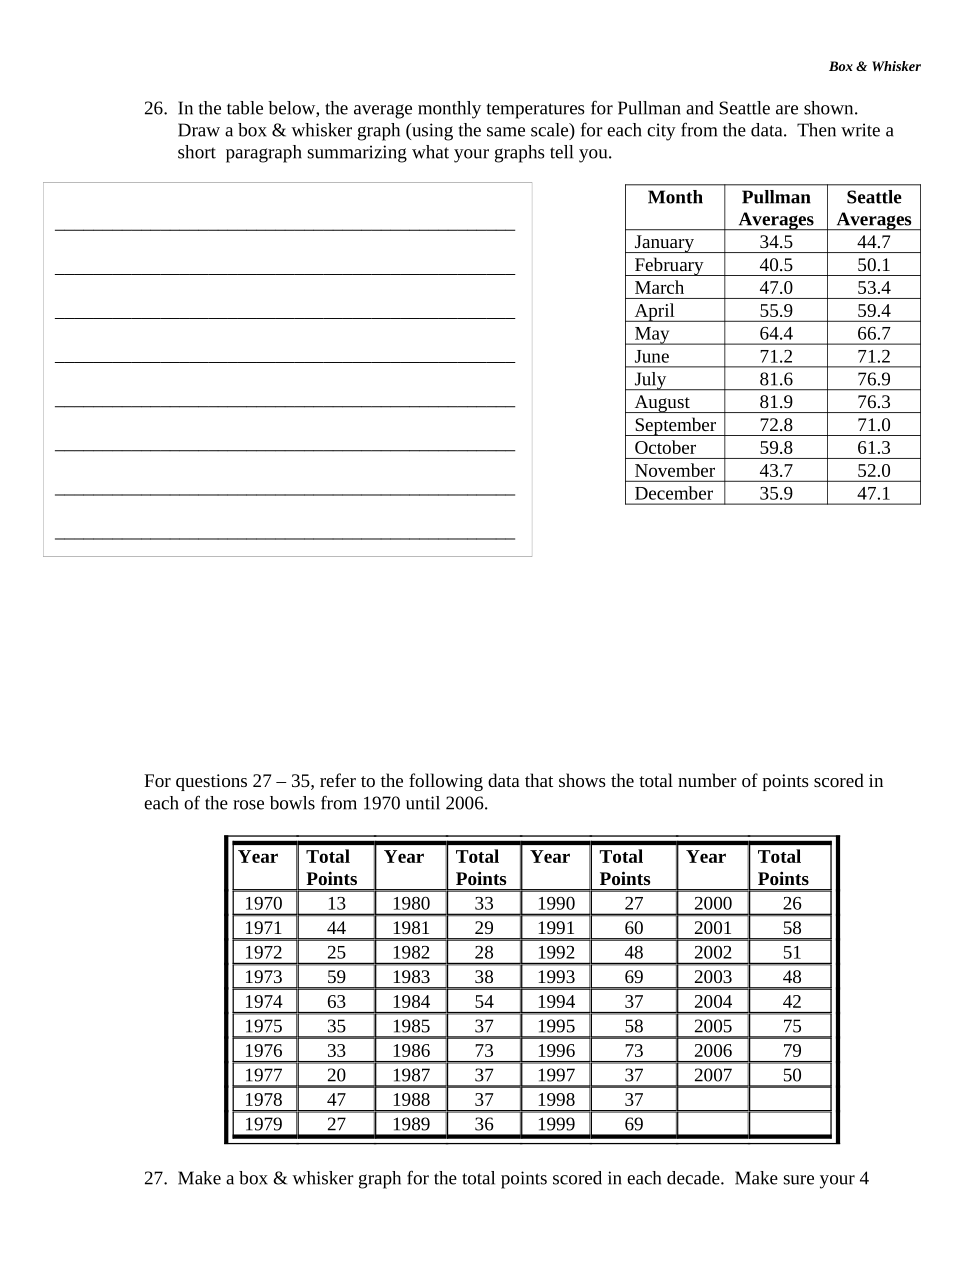
Write a short paragraph comparing the temperatures in both cities.
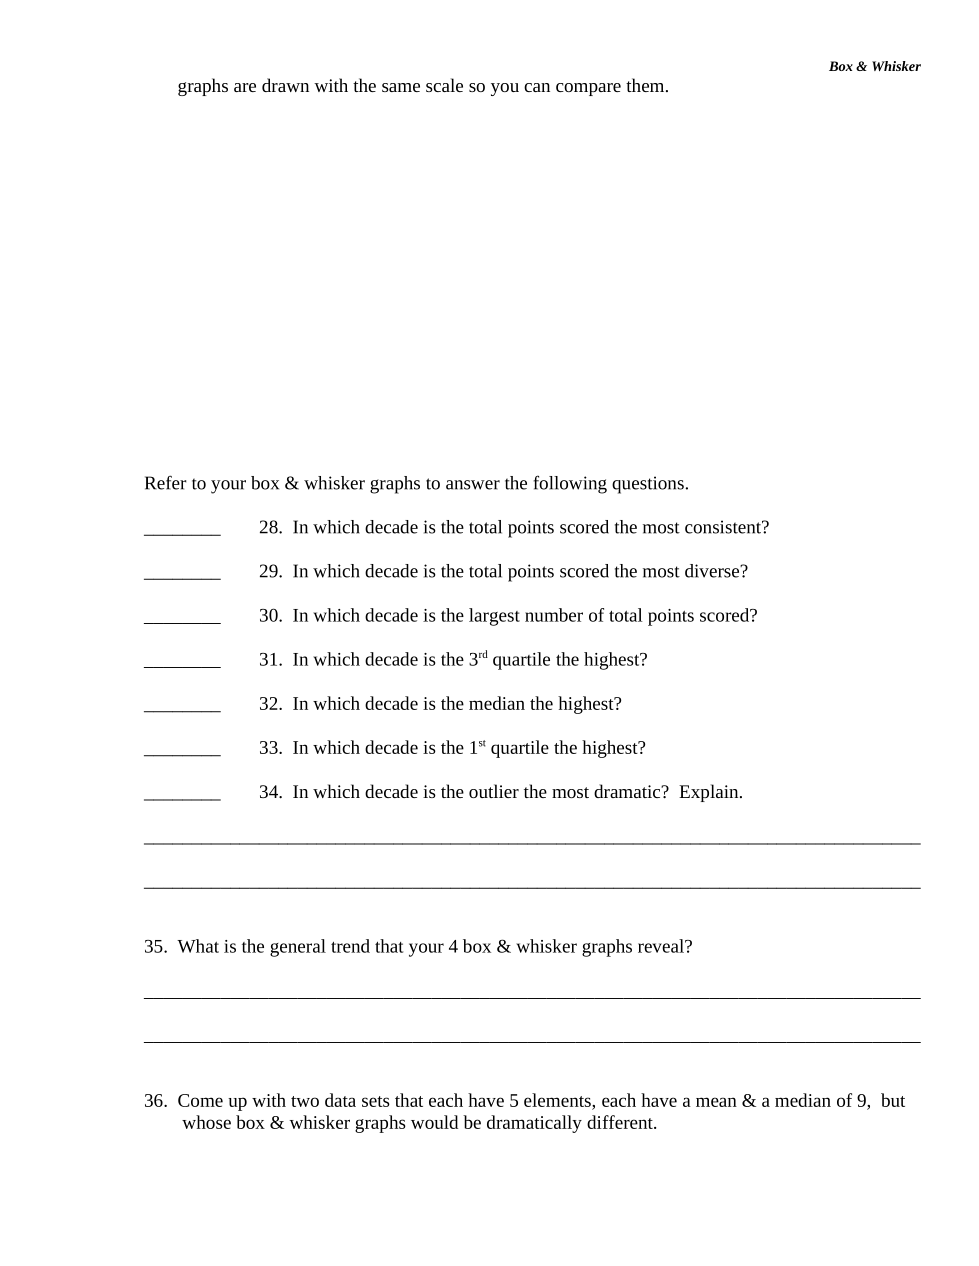
25%
75%
50%
100%
25%
50%
75%
100%
100%
75%
50%
25%
48-190
0-60
20-48
20-190
False
False
False
False
False
False
False
False
False