HW Graphing Exponential Functions
star
star
star
star
star
Posljednje ažuriranje about 3 years ago
13
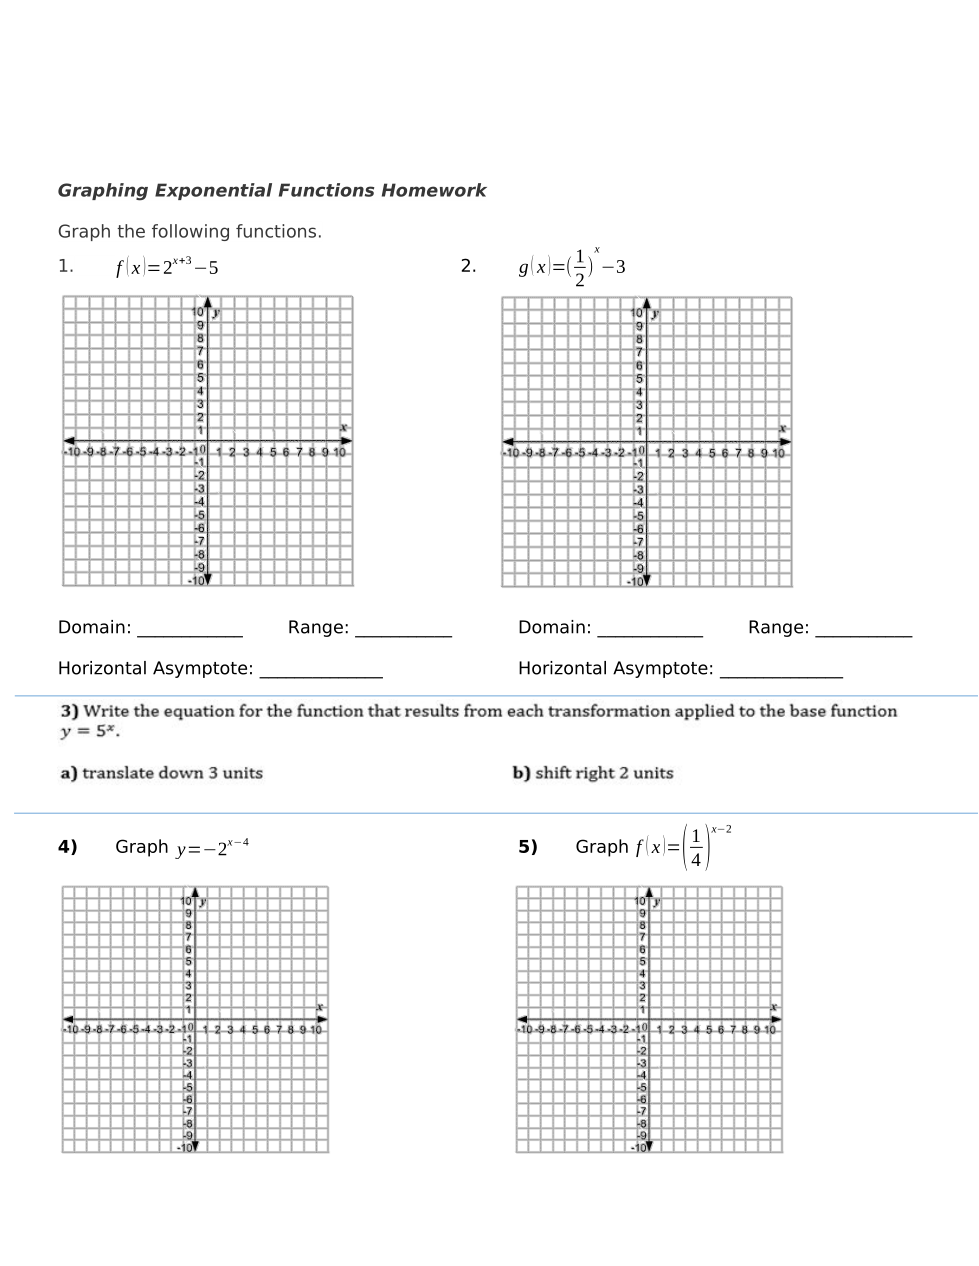
Graph the function & write the range.
The equation for 3a) is
Write the equation for 3b).
Graph the function & select the correct domain, range, and horizontal asymptote for the function.
Graph the function and write the range.
Graph the function and write the horizontal asymptote.
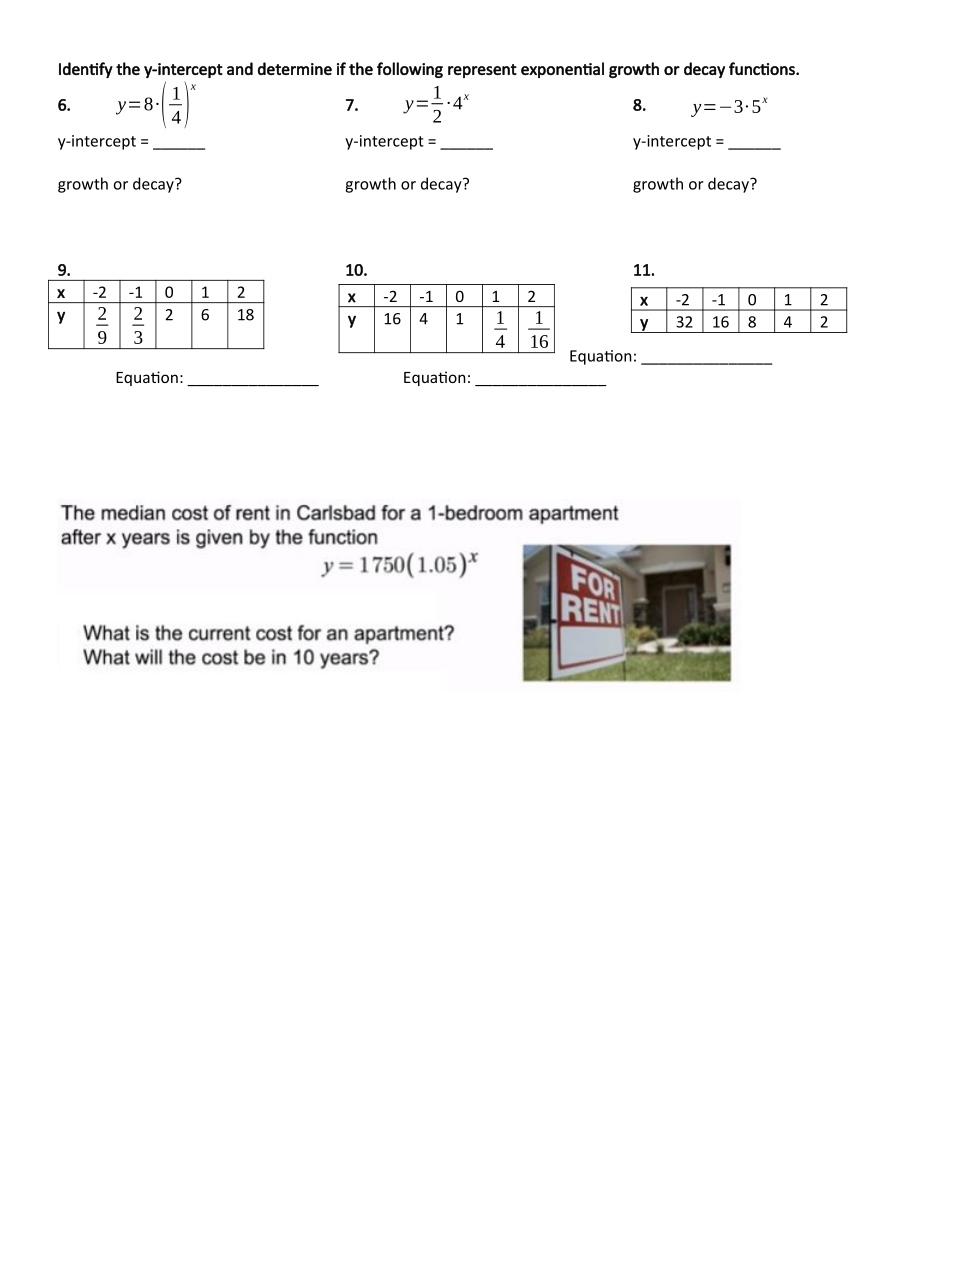
Select the y-intercept and whether the function is growth or decay.
Does this function represent growth or decay?
What is the y-intercept? (Hint: sub in 0 for x)
Write the equation for the table.
a is the y-intercept:
b is the common ratio
Write the equation for the table.
a is the y-intercept:
b is the common ratio
Write the equation for the table.
a is the y-intercept:
b is the common ratio
The cost at year 0.
The cost in 10 years. Round to the nearest cent (hundredth).