NS: 1.4 (1/10) Version B
star
star
star
star
star
Posljednje ažuriranje about 3 years ago
10

0
0
0
0
0

0
0
0
2
1
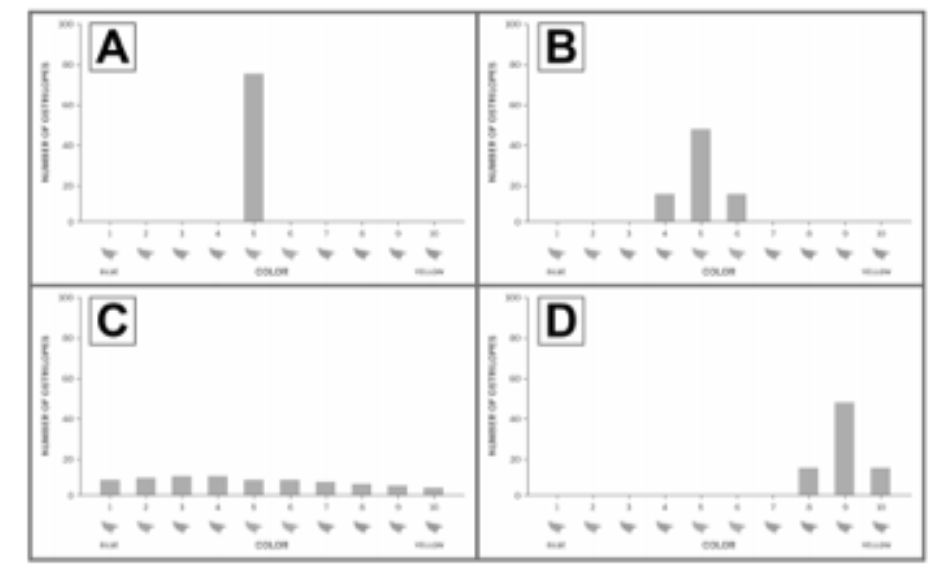
Which histogram shows a population that’s all one color?
Which histogram shows a population with a lot of variation?
Which histogram shows a population with mostly yellow ostrilopes and some variation?
Which histogram shows the same variation as histogram B but a different distribution of traits?
What information can you gather about the two generations below?
Was there variation in Generation 1?
Was there variation in Generation 2?
Do:
· Open the Natural Selection Simulation and open the mode: Fur and Temperature A.
· Change the temperature of the environment to cold (Level 1) by moving the Temperature slider.
· Press RUN and observe the population for at least 50 generations.
· Press ANALYZE and compare starting and ending histograms.
Why do you think the distribution of fur traits changed over time?
CFS:
accurately uses visual data to draw conclusions on population variations
describes the cause and effect relationship between environmental factors and species traits
Predicting Fur Traits in a Cooling Environment
Use the Modeling Tool activity: Fur and Temperature, Population B to show your prediction about how the distribution of traits in Population B will change as a result of the environment becoming cold.
Goal:
Predict how and why Population B will change after the environment changes from warm to cold.
Do:
Analyze Histogram 1 and label that histogram with any Trait labels that apply.
• Predict Histogram 2 by shading in the bars for the different trait levels.
Predict the traits in Generation 2 when the environment changes from WARM to COLD