3rd Math Day 4 M6.L2&3 Exit Ticket
star
star
star
star
star
Last updated over 5 years ago
3 Nsɛmmisa
2
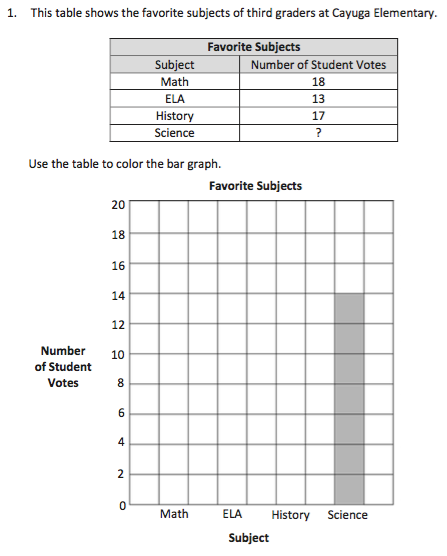
Use the table to color the bar graph.
Use the table to color the bar graph.
1
1
Use the table to color the bar graph.
How many students voted for science?
How many more students voted for math than for science? Write a number sentence to show your thinking.