Unit 7.1 Lesson 5 Embedded Assessment Form ACC: Who Has the Bigger Increase in Splat?
Directions: Watch the Splat-o-Meter video to review. Answer the questions.
Directions: Watch the Splat-o-Meter video to review. Answer the questions.
The Situation:
Robin and Katelyn are learning about how the speed or mass of a moving object affects that object’s kinetic energy. To study this, they have been dropping watermelons off of ladders and off of the school roof. They’ve tried dropping watermelons from different heights (to change the speed), and they’ve tried dropping different sizes of watermelons (to change the mass). They’ve seen that with each change, the size of the watermelon “splat” changes, which shows that the kinetic energy of the watermelon has changed.
Robin and Katelyn now want to conduct an experiment.
Katelyn decides she will change the speed (and only the speed) of the watermelons she drops.
Robin decides he will change the mass (and only the mass) of the watermelons he drops.
Robin and Katelyn will then compare their results to see how each change affected the falling watermelons’ kinetic energy.
Katelyn’s Experiment - How does changing speed affect the splat?
Katelyn collected data from dropping watermelons of the same mass from different heights and studying the amount of kinetic energy in the splat (by comparing the size of the splat). Below is her data table and graph.

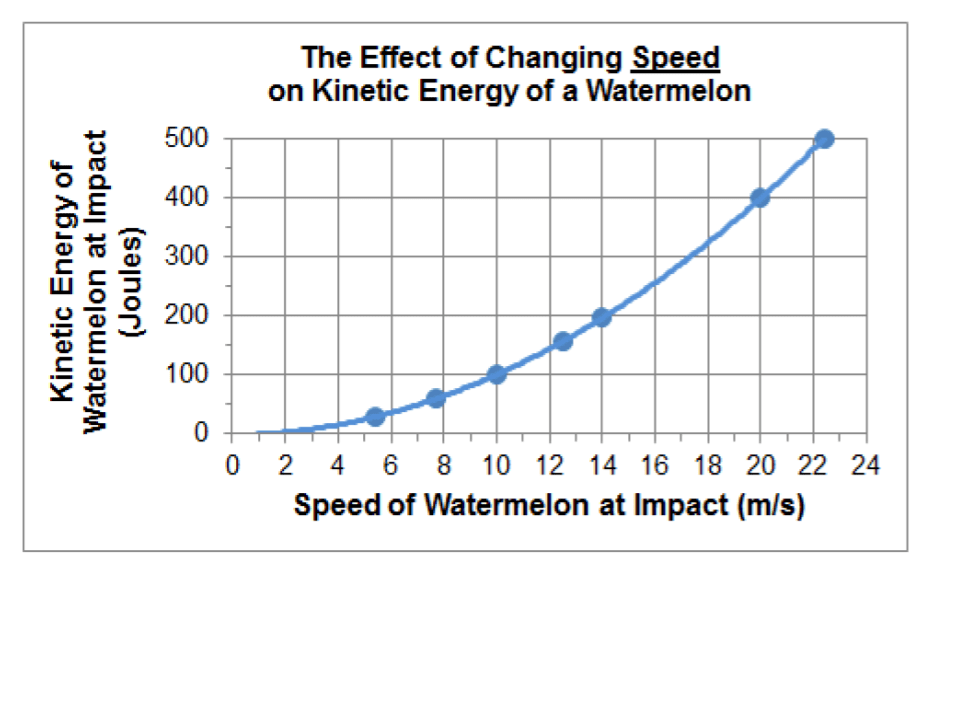
For Katelyn’s experiment, identify the independent variable (the thing we change in the experiment) and identify the dependent variable (the thing affected by the independent variable). (Hint: Use Title of graph as a clue.)
The independent variable is: _____________________
Robin’s Experiment - How does changing mass affect the splat?
Robin collected data from dropping watermelons of different mass from the same height and studying the amount of kinetic energy in the splat. Below is his data table.

For Robin’s experiment, identify the independent variable (the thing we change in the experiment), and identify the dependent variable (the thing affected by the independent variable).
The independent variable is : _____________________
The dependent variable is : _____________________
Using Robin’s data table, complete a graph of Robin’s experiment. Remember to include a title and labels on both axes.
(Hint: The independent variable goes on the x-axis.)
Using the data in Katelyn’s and Robin’s graphs, identify which of the following statements is correct about the relationship between speed, mass, and the kinetic energy of a moving object.
Using Robin’s and Katelyn’s graphs, do either of Katelyn’s or Robin’s graphs contain evidence that their variables have a nonlinear relationship? Explain your thinking. (Hint: Nonlinear means not a straight line.)
Robin and Katelyn's teacher now asks them which change would have a bigger effect on the kinetic energy of the watermelon: doubling the mass or doubling the speed?
Katelyn says if they keep the same mass but double the speed from 10 m/s to 20 m/s they’ll get a bigger increase in kinetic energy and, therefore, a bigger increase in the size of the splat.
Robin says if they keep the same speed but double the mass from 2 kg to 4 kg they’ll get a bigger increase in kinetic energy and, therefore, a bigger increase in the size of the splat.
Refer back to Katelyn's data from Part I. When Katelyn kept the same mass but doubled the speed from 10 m/s to 20 m/s, what happened to the kinetic energy/size of splat?
Refer back to Robin's data from Part I. When Robin kept the same speed but doubled the mass from 2 kg to 4 kg, what happened to the kinetic energy/size of splat?
Who is right, and why?
The dependent variable is: ______________________
