G2M7 TOPIC A QUIZ
star
star
star
star
star
Posljednje ažuriranje over 5 years ago
11
Napomena autora:
Eureka G2 M7 Topic A Quiz
Eureka G2 M7 Topic A Quiz
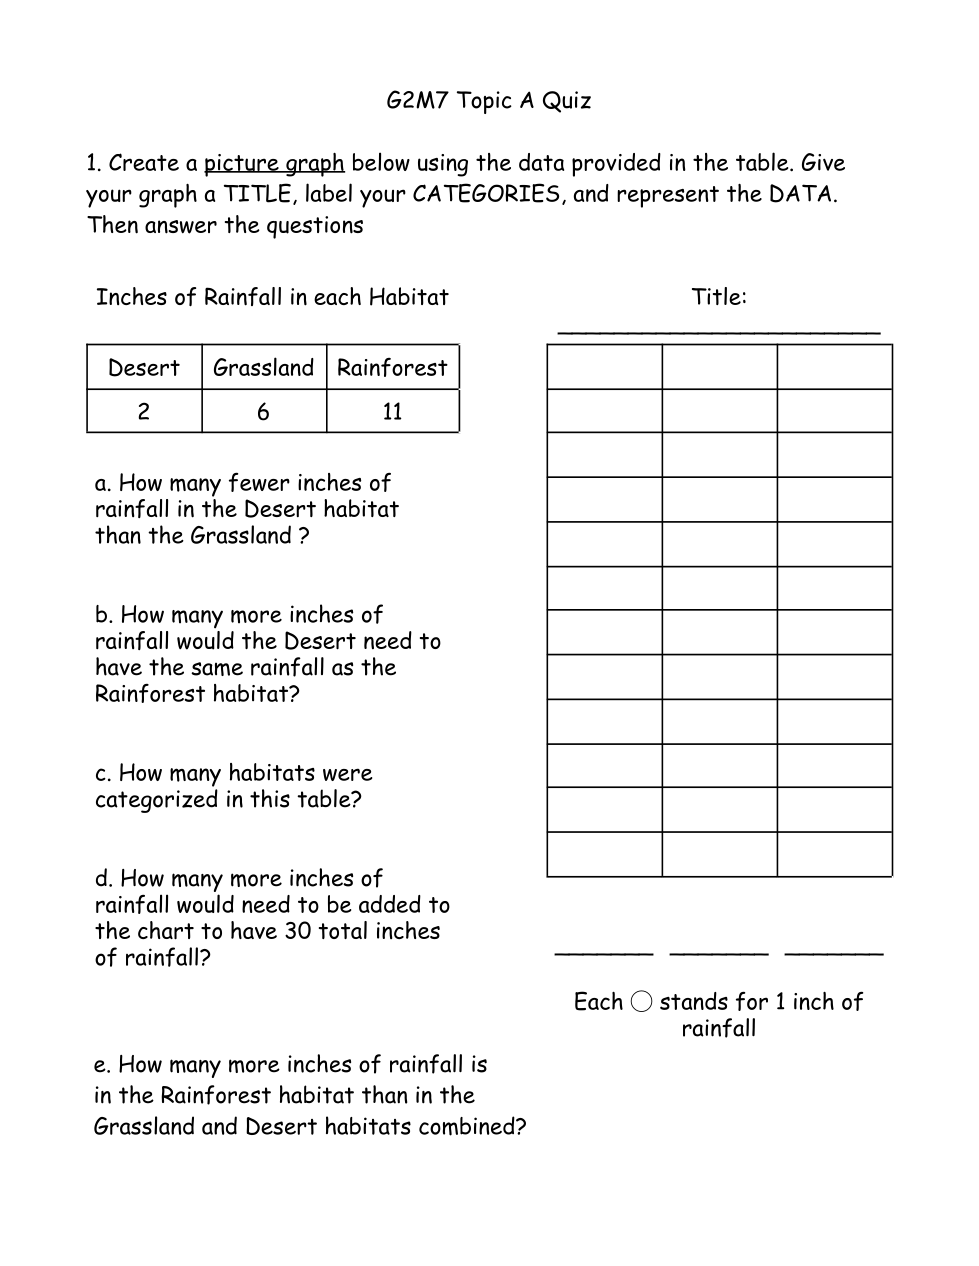
Create a PICTURE GRAPH using the data provided in the table. Give your graph a TITLE, label your CATEGORIES, and represent the DATA>
How many fewer inches of rainfall was in the Desert habitat than the Grasslands?
How many more inches of rainfall would the Desert need to have the same amount of rainfall as the Rainforest?
How many HABITATS were categorized in this table?
How many more inches of rainfall would need to be added to make a TOTAL of 30 inches of rainfall?
How many more inches of rain fell in the Rainforest than in the Grasslands and Desert combined?
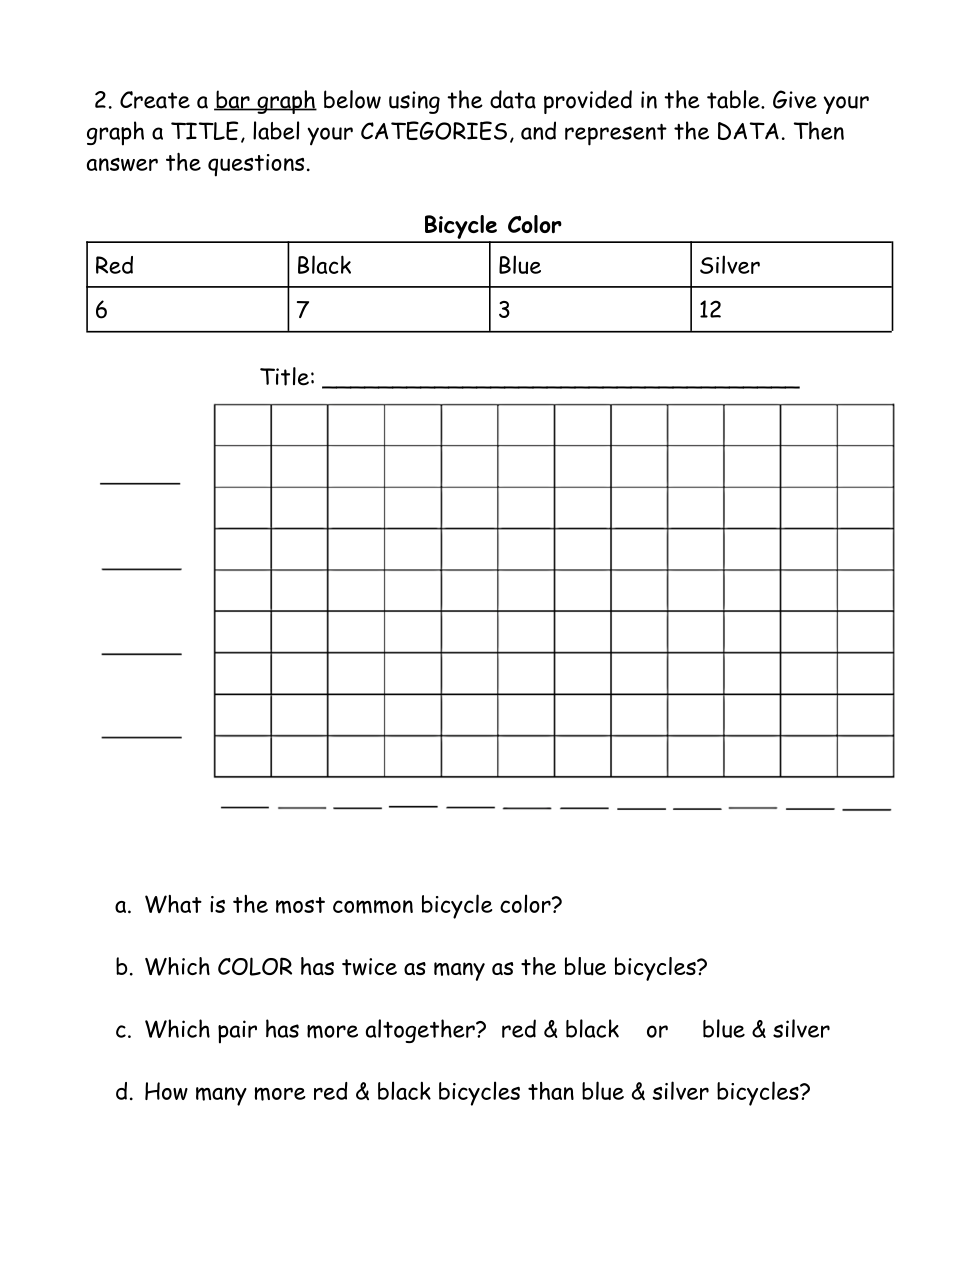
What was the most common bicycle color?
Which color bicycle had TWICE as many as the BLUE bicycles?
Which pair of bicycles had more altogether?
How many more blue & silver bicycles were there than red & black bicycles?