DHS Measures of Center and Variation LEARNING TASK
star
star
star
star
star
Last updated over 5 years ago
55 Nsɛmmisa
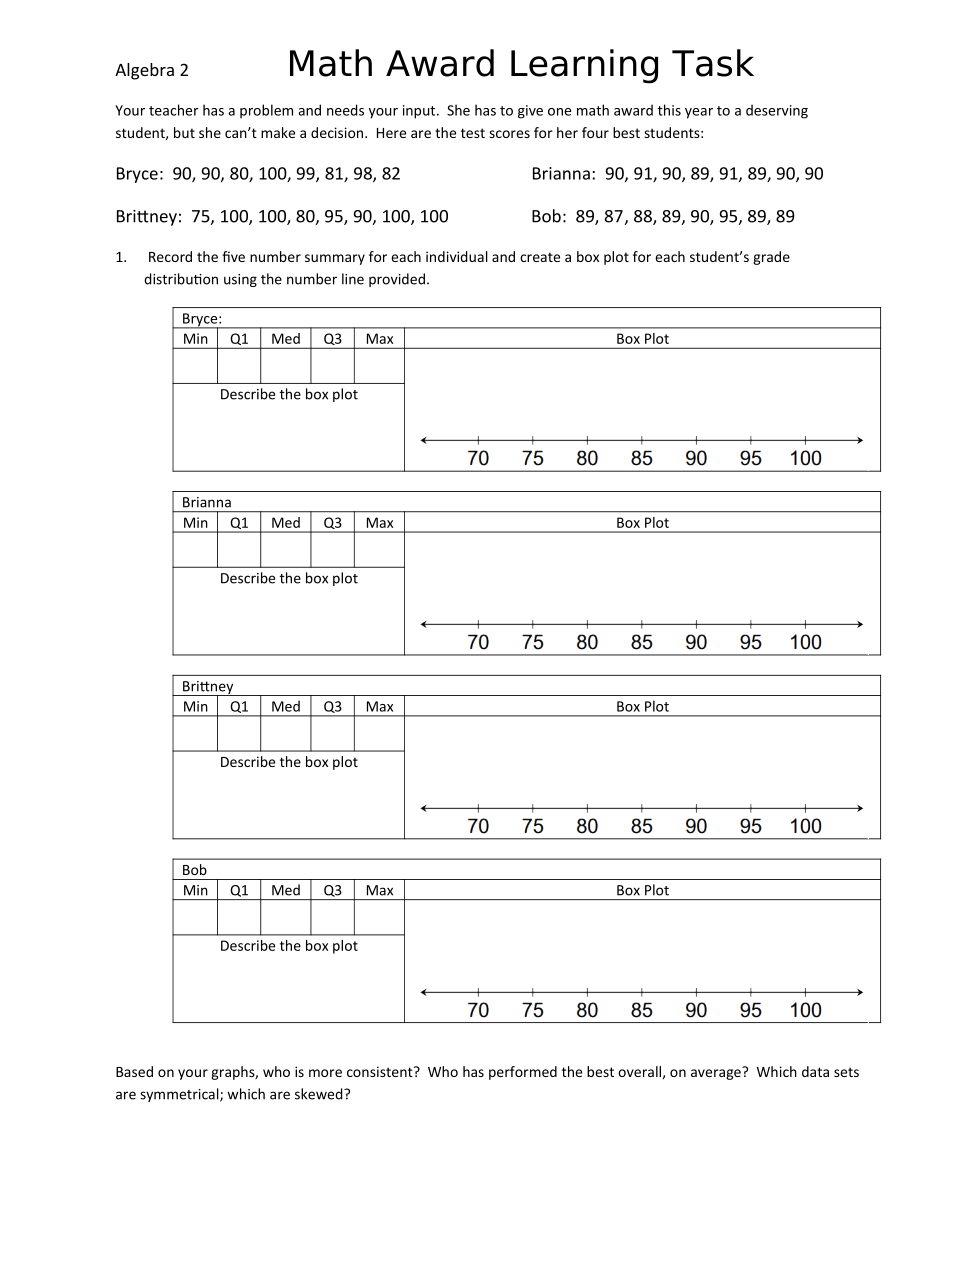
Based on the box plots, who is MOST CONSISTENT in their grades?
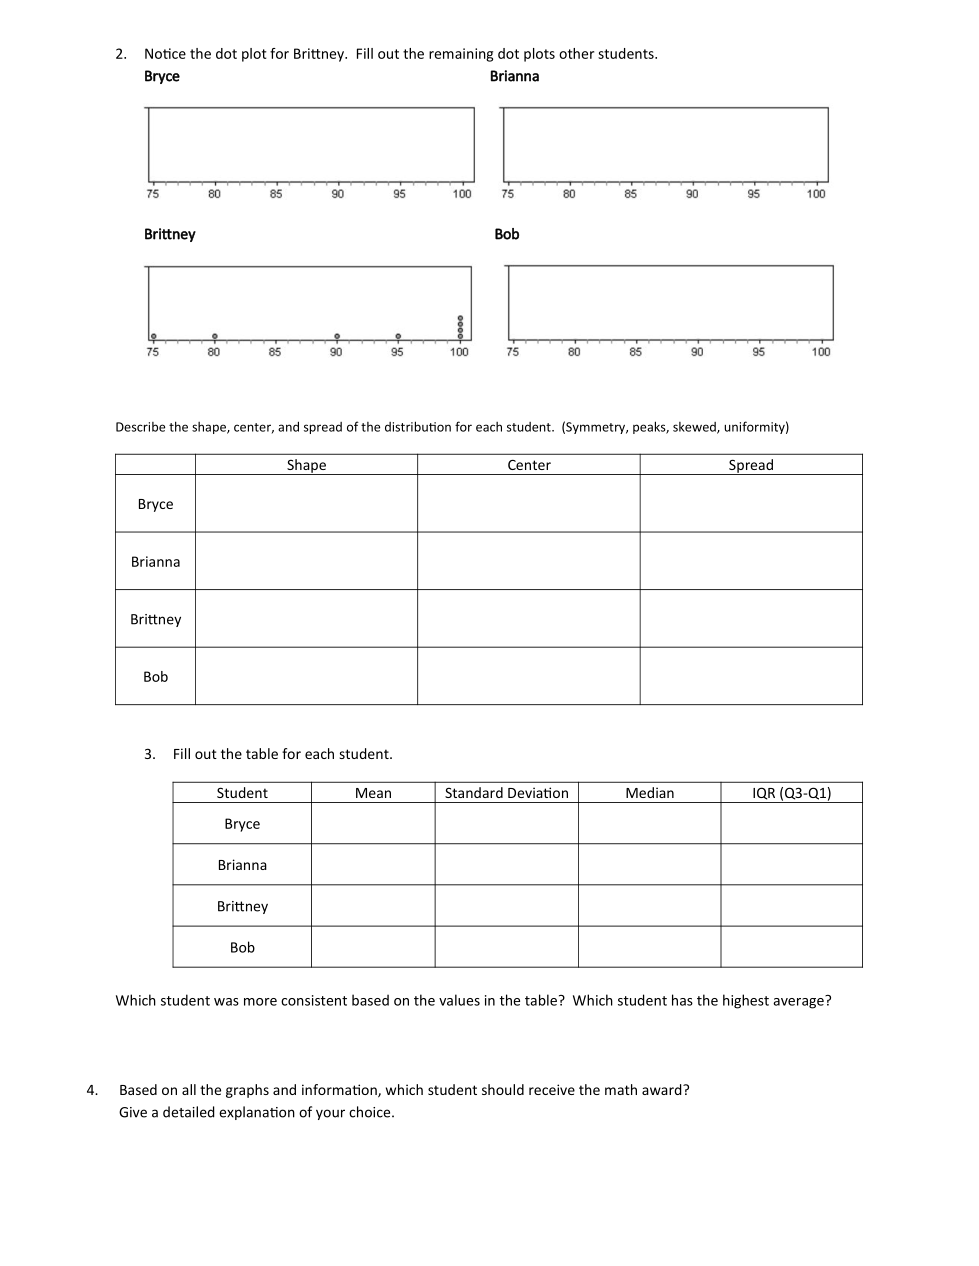
Look at the dot plot made for Brittney's data. Create a dog plot for Bryce.
Based on ALL of the information above, which student should receive the math award? Give a detailed explanation of your choice.
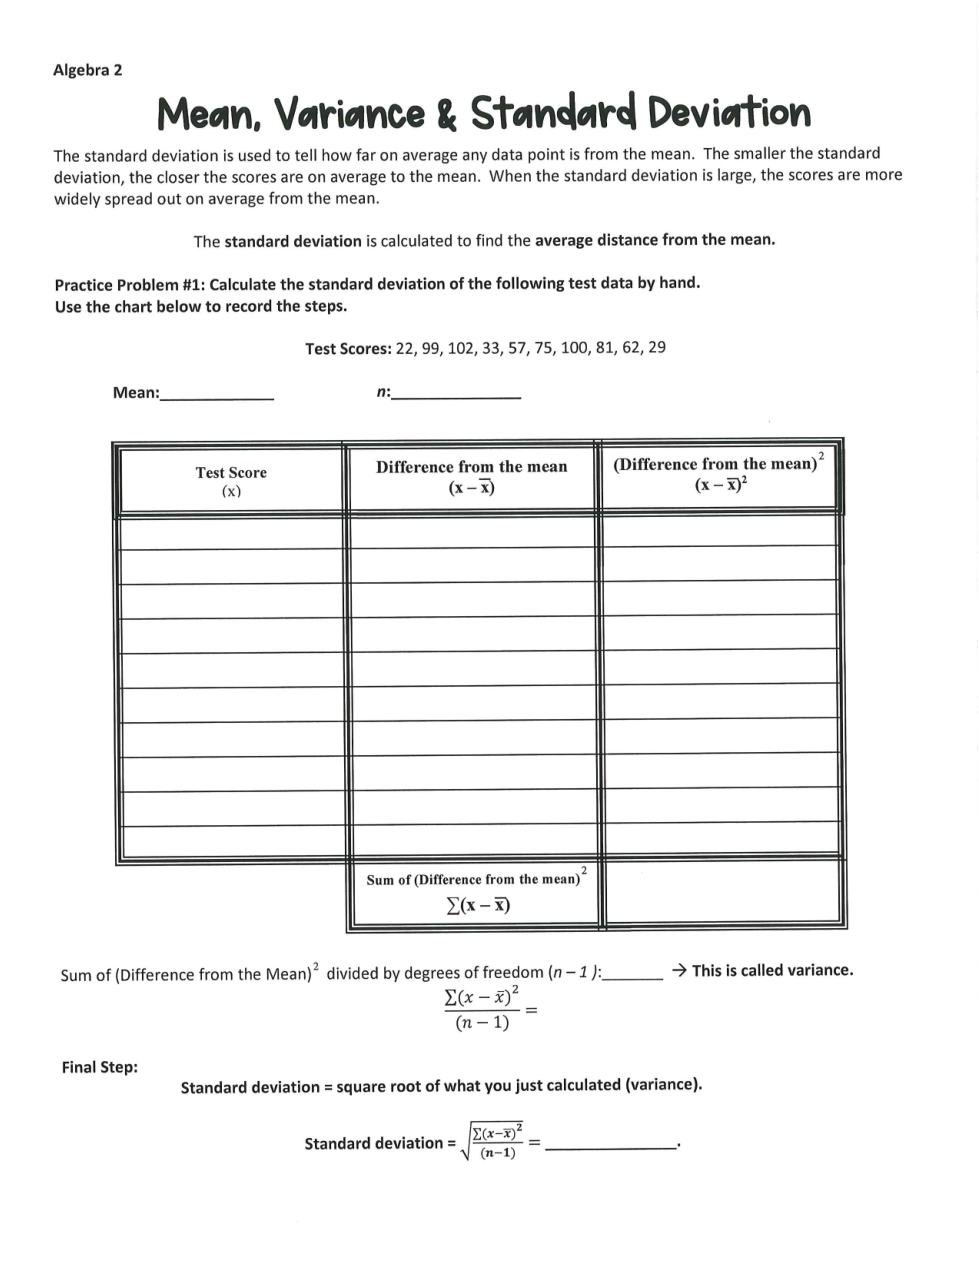
What is the MEAN of the data of Test Scores?
What is the number of scores in the data set?
What is the value of the variance calculated by:
Round to the nearest tenth.
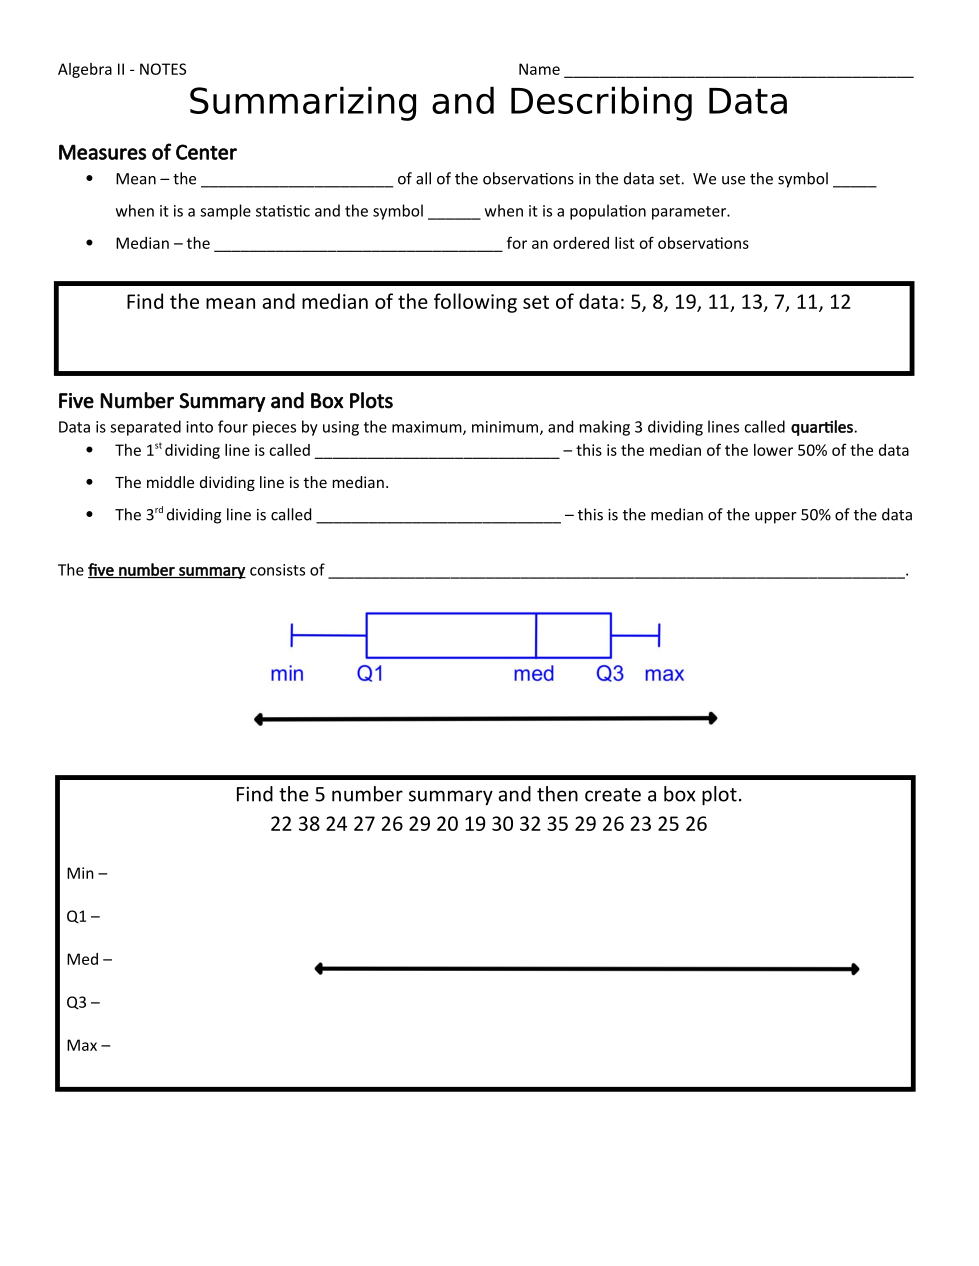
What does the MEAN describe?
What is the symbol meaning the mean of a sample?
What is the symbol meaning the mean of a population?
What does the MEDIAN describe?
What is the MEAN of the data set?
What is the MEDIAN of the data set?
What is the 1st dividng line of a box plot called?
What is the 3rd dividng line of a box plot called?
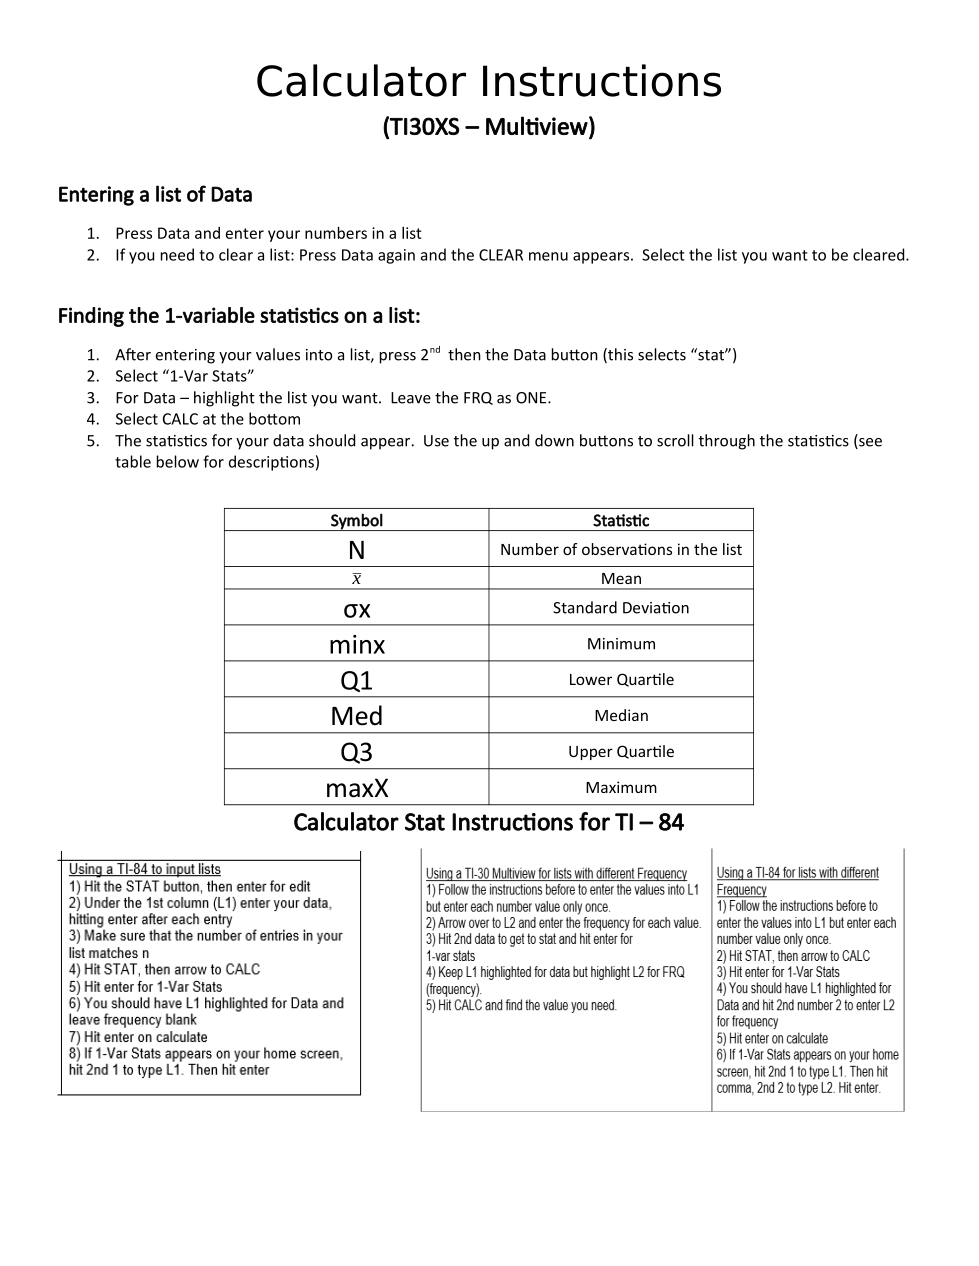
What statistical measures are included in the five number summary used to make a box plot?
What is the minimum value for this set of data?
What is the 1st quartile value for this set of data?
What is the median value for this set of data?
What is the 3rd quartile value for this set of data?
What is the maximum value for this set of data?
Draw a box plot that includes your 5 number summary
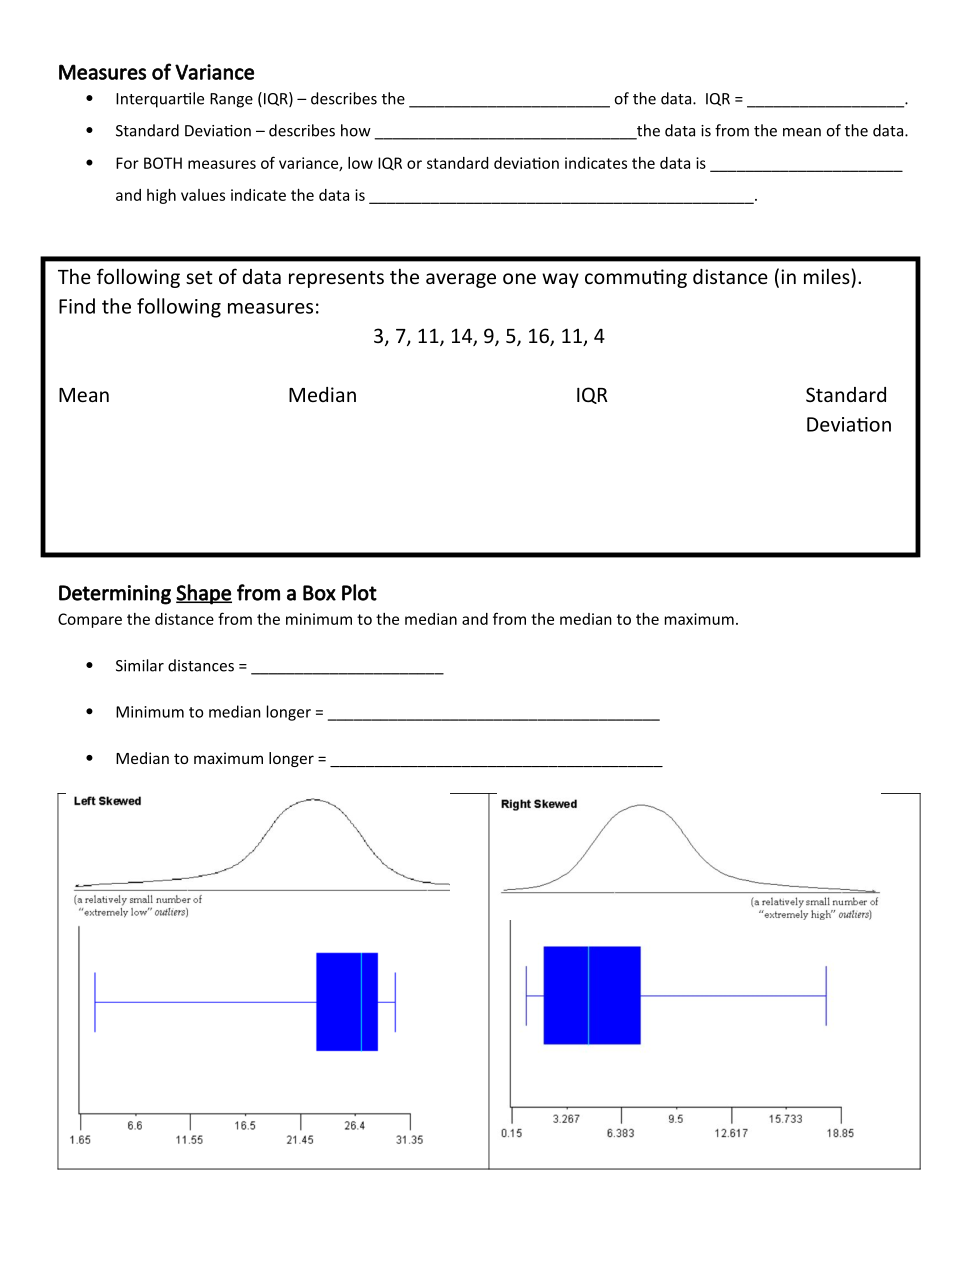
What does the Interquartile range (IQR) describe?
How do you calculate the IQR for a set of data?
What does the standard deviation describe for a set of data?
Data sets with LOW IQR and LOW STANDARD DEVIATION indicate the data is spread far apart vs data set with HIGH IQR and HIGH STANDARD DEVIATION which would indicate the data is close together.
What is the MEAN for this set of data? Round to the nearest tenth if needed.
What is the MEDIAN for this set of data? Round to the nearest tenth if needed.
What is the IQR for this set of data? Round to the nearest tenth if needed.
What is the STANDARD DEVIATION for this set of data? Round to the nearest tenth if needed.
The symbol for standard deviation is
Compare the distance from the minimum value to the median AND the median to the maximum...
| Draggable item | arrow_right_alt | Corresponding Item |
|---|---|---|
The distance from the minimum to median is LONGER than distance from median to maximum | arrow_right_alt | Data set is SYMMETRICAL |
The distance from the median to the maximum is LONGER than distance from minimum to median | arrow_right_alt | Data set is SKEWED LEFT |
Both distances are similar in length | arrow_right_alt | Data set is SKEWED RIGHT |
Record the 5 number summary AND create a box plor for Bryce.
Record the 5 number summary AND create a box plor for Brianna.
Record the 5 number summary AND create a box plor for Brittney.
Record the 5 number summary AND create a box plor for Bob.
Who has performed the best overall, on average?
Which of the data sets would be considered SKEWED?
Look at the dot plot made for Brittney's data. Create a dog plot for Brianna.
Look at the dot plot made for Brittney's data. Create a dog plot for Bob.
Describe the shape, center, and spread of the distribution for each. Include things like symmetry, peaks, skewness, uniformity, etc.
Fill out the info in the table.
Complete the table by determining the difference of each of the test scores from the mean and then squaring each of those values. Finally, find the sum of the last column.
What is the standard deviation of the test scores calculated by:
Round to the nearest tenth.
What this value for standard deviation tell you about the data set?
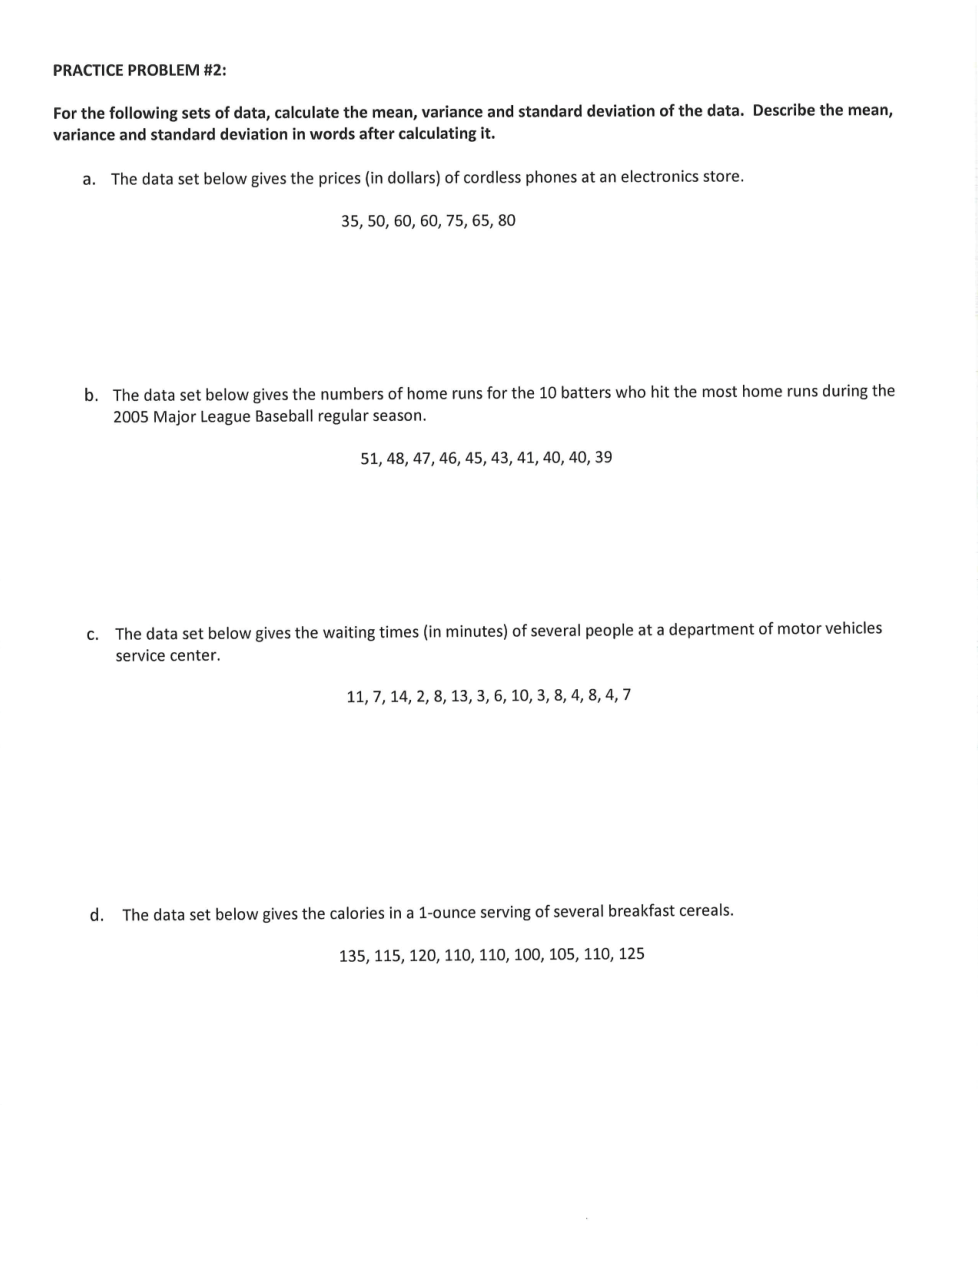
What is the MEAN? Round to the nearest tenth.
What is the VARIANCE? Round to the nearest tenth.
What is the STANDARD DEVIATION? Round to the nearest tenth.
What is the MEAN?
What is the VARIANCE? Round to the nearest tenth.
What is the STANDARD DEVIATION? Round to the nearest tenth.
What is the MEAN? Round to the nearest tenth.
What is the VARIANCE? Round to the nearest tenth.
What is the STANDARD DEVIATION? Round to the nearest tenth.
What is the MEAN? Round to the nearest tenth.
What is the VARIANCE? Round to the nearest tenth.
What is the STANDARD DEVIATION? Round to the nearest tenth.