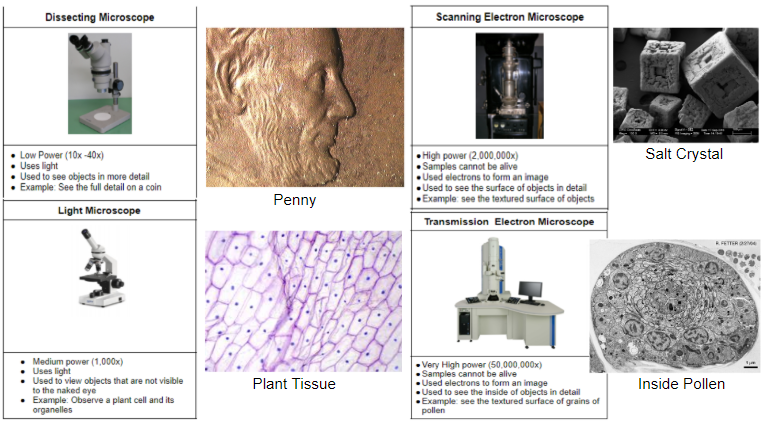
2 What is Biology Practice
star
star
star
star
star
Last updated over 5 years ago
13 Nsɛmmisa
1
1
1
1
1
1
1
1
1
1
1
1
1
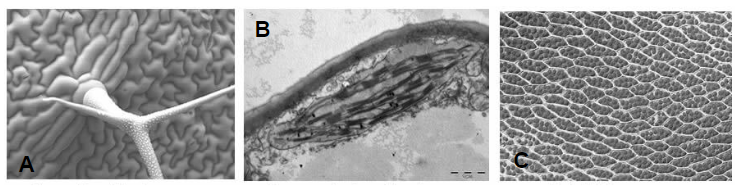
Look at the image above, which microscope was used for image A?
Look at the image above, which microscope was used for image B?
Look at the image above, which microscope was used for image C?
What microscope was used for this image? (image shows a honey bee)

What microscope was used for this image? (image shows the eye of a honey bee)

What microscope was used for this image? (image shows the eye of pollen, Hint: these are colored images)

What microscope was used for this image? (image shows the inside of a mitochondrion)

The graph shows how the activity of an enzyme changes over a range of temperature values. Which of the following is the optimal (best) temperature for the ChesAdams (blue line) enzyme?

The graph shows how the activity of an enzyme changes over a range of temperature values. Which of the following is the optimal (best) temperature for the GlenKepple (pink line) enzyme?
The graph shows how the activity of an enzyme changes over a range of pH values. Which of the following conclusions can be drawn from this graph?

The following experiment was performed: Students watched the same cartoon either alone or with others and then rated how funny they found the cartoon to be. What was the Independent variable?
The following experiment was performed: Students watched the same cartoon either alone or with others and then rated how funny they found the cartoon to be. What was the dependent variable?
The following experiment was performed: Students watched the same cartoon either alone or with others and then rated how funny they found the cartoon to be. What was the control?