1
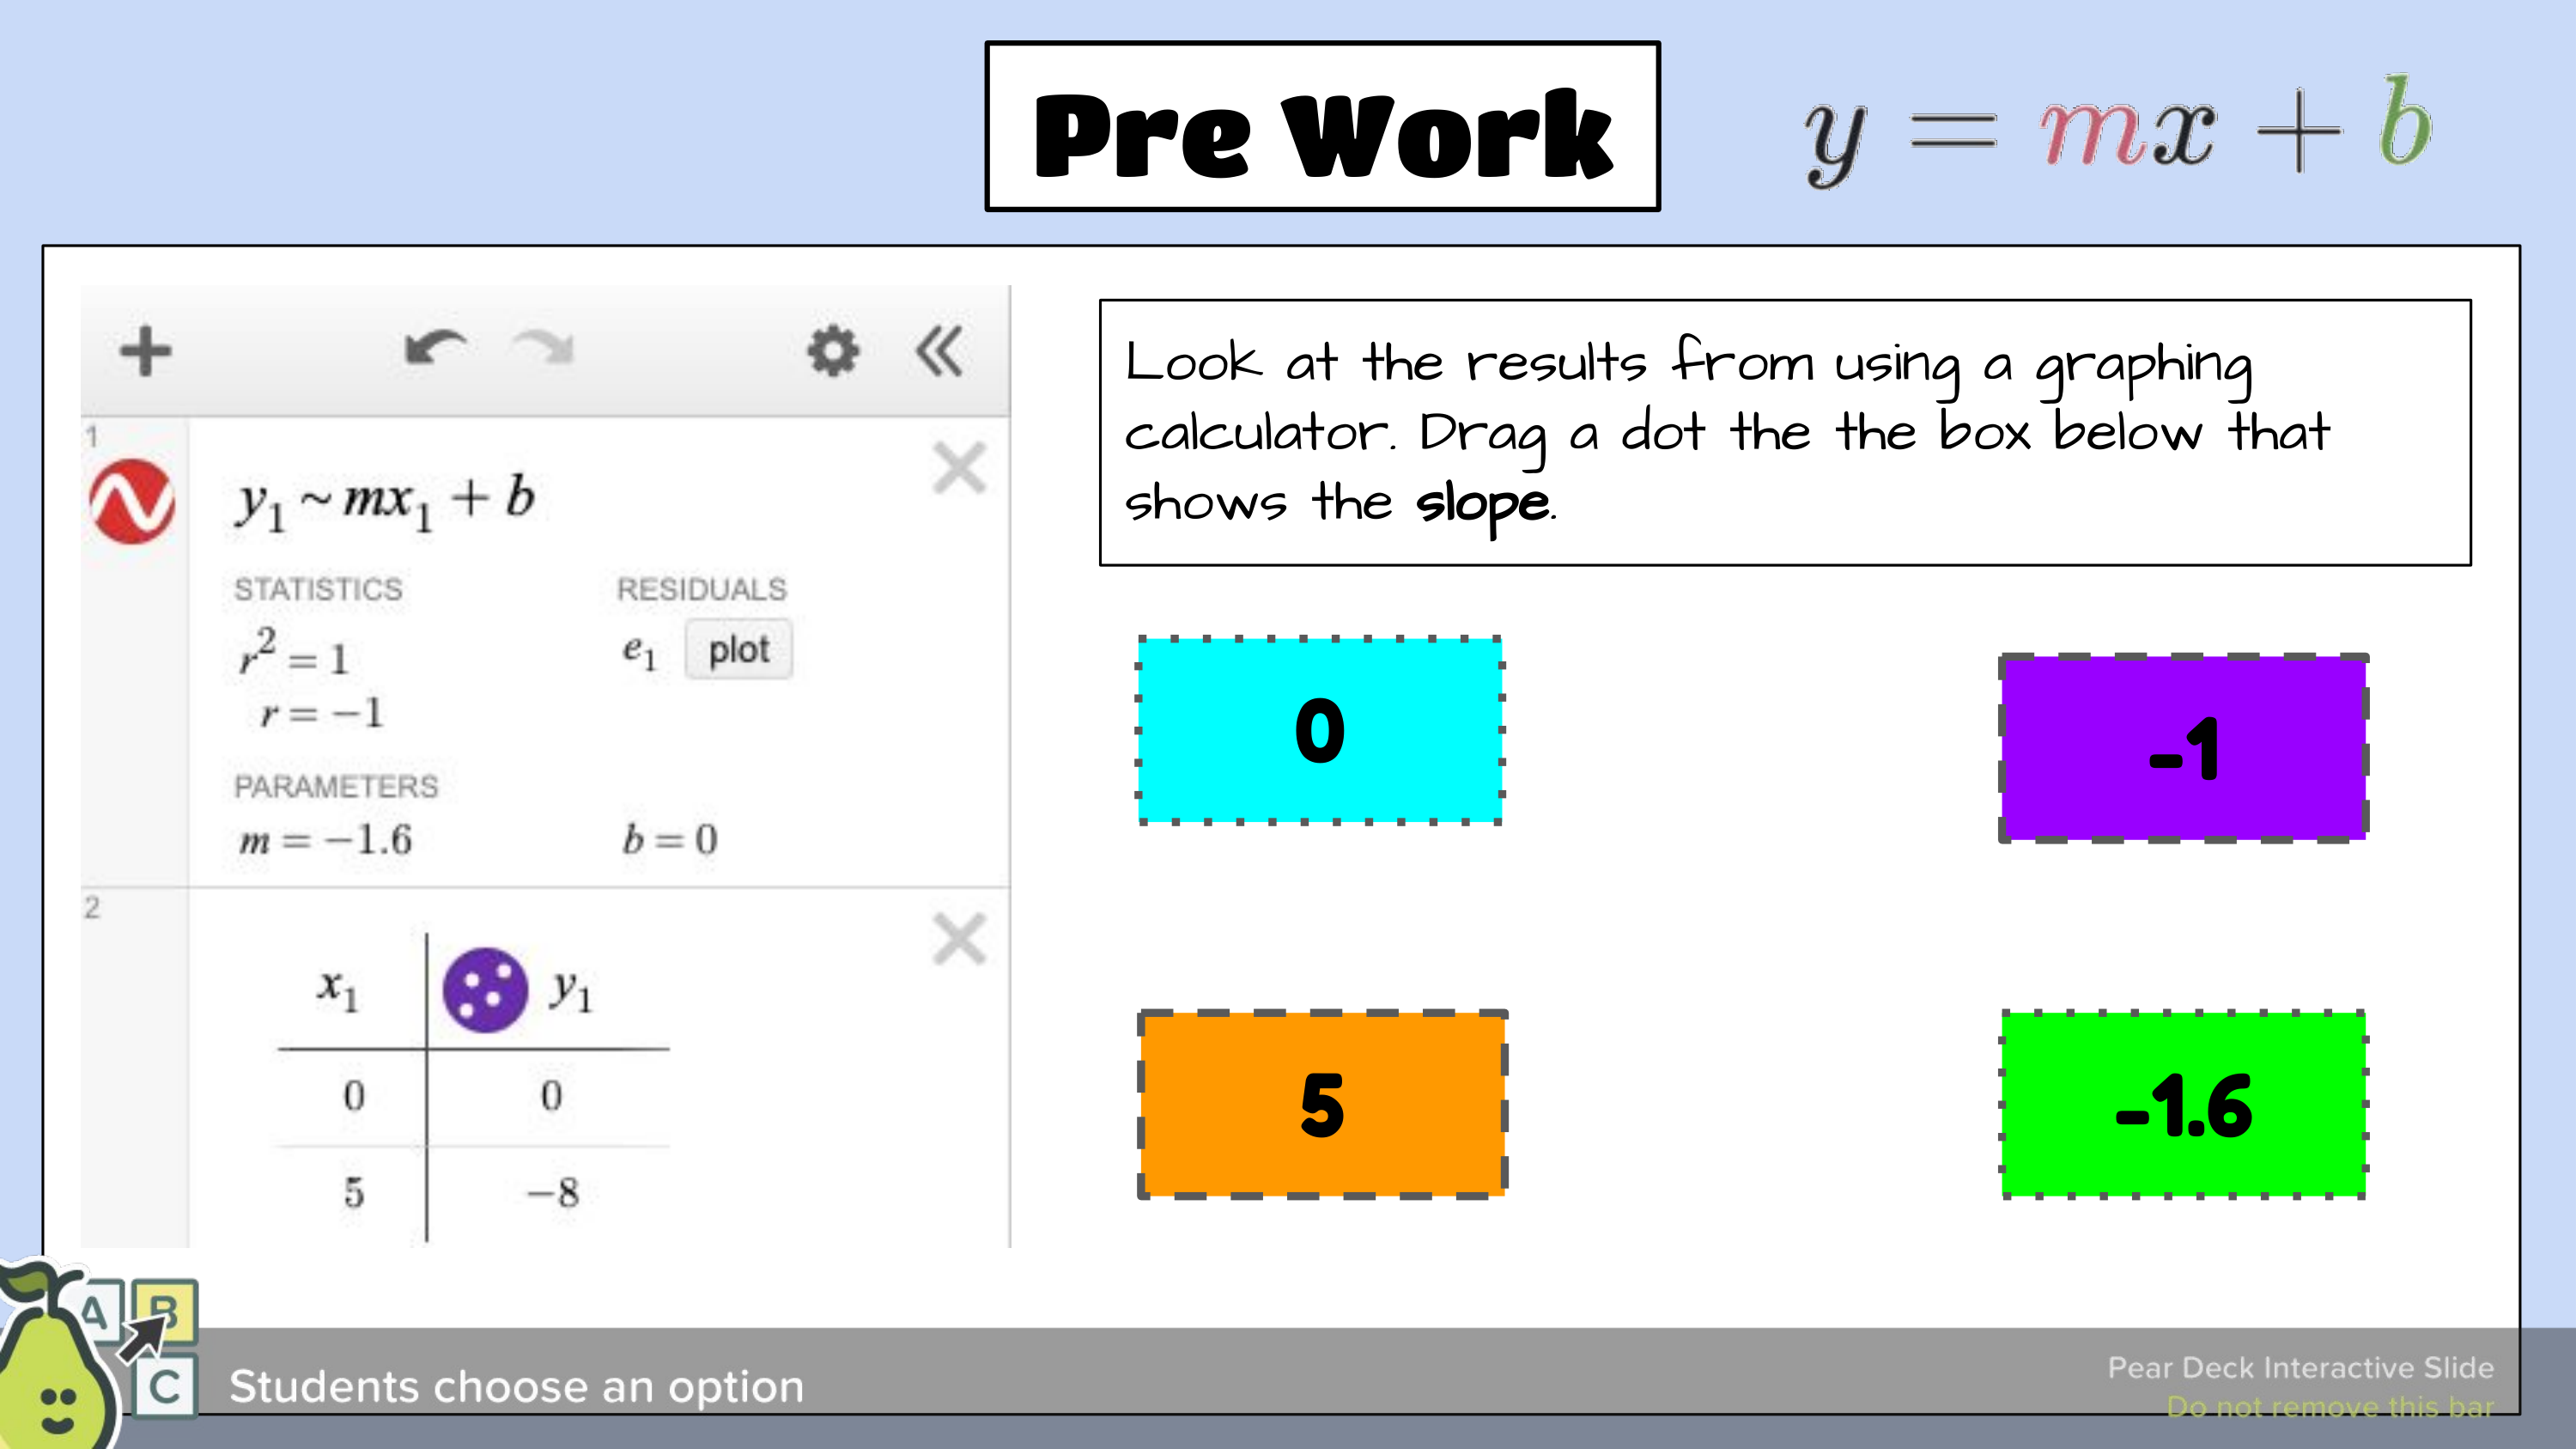
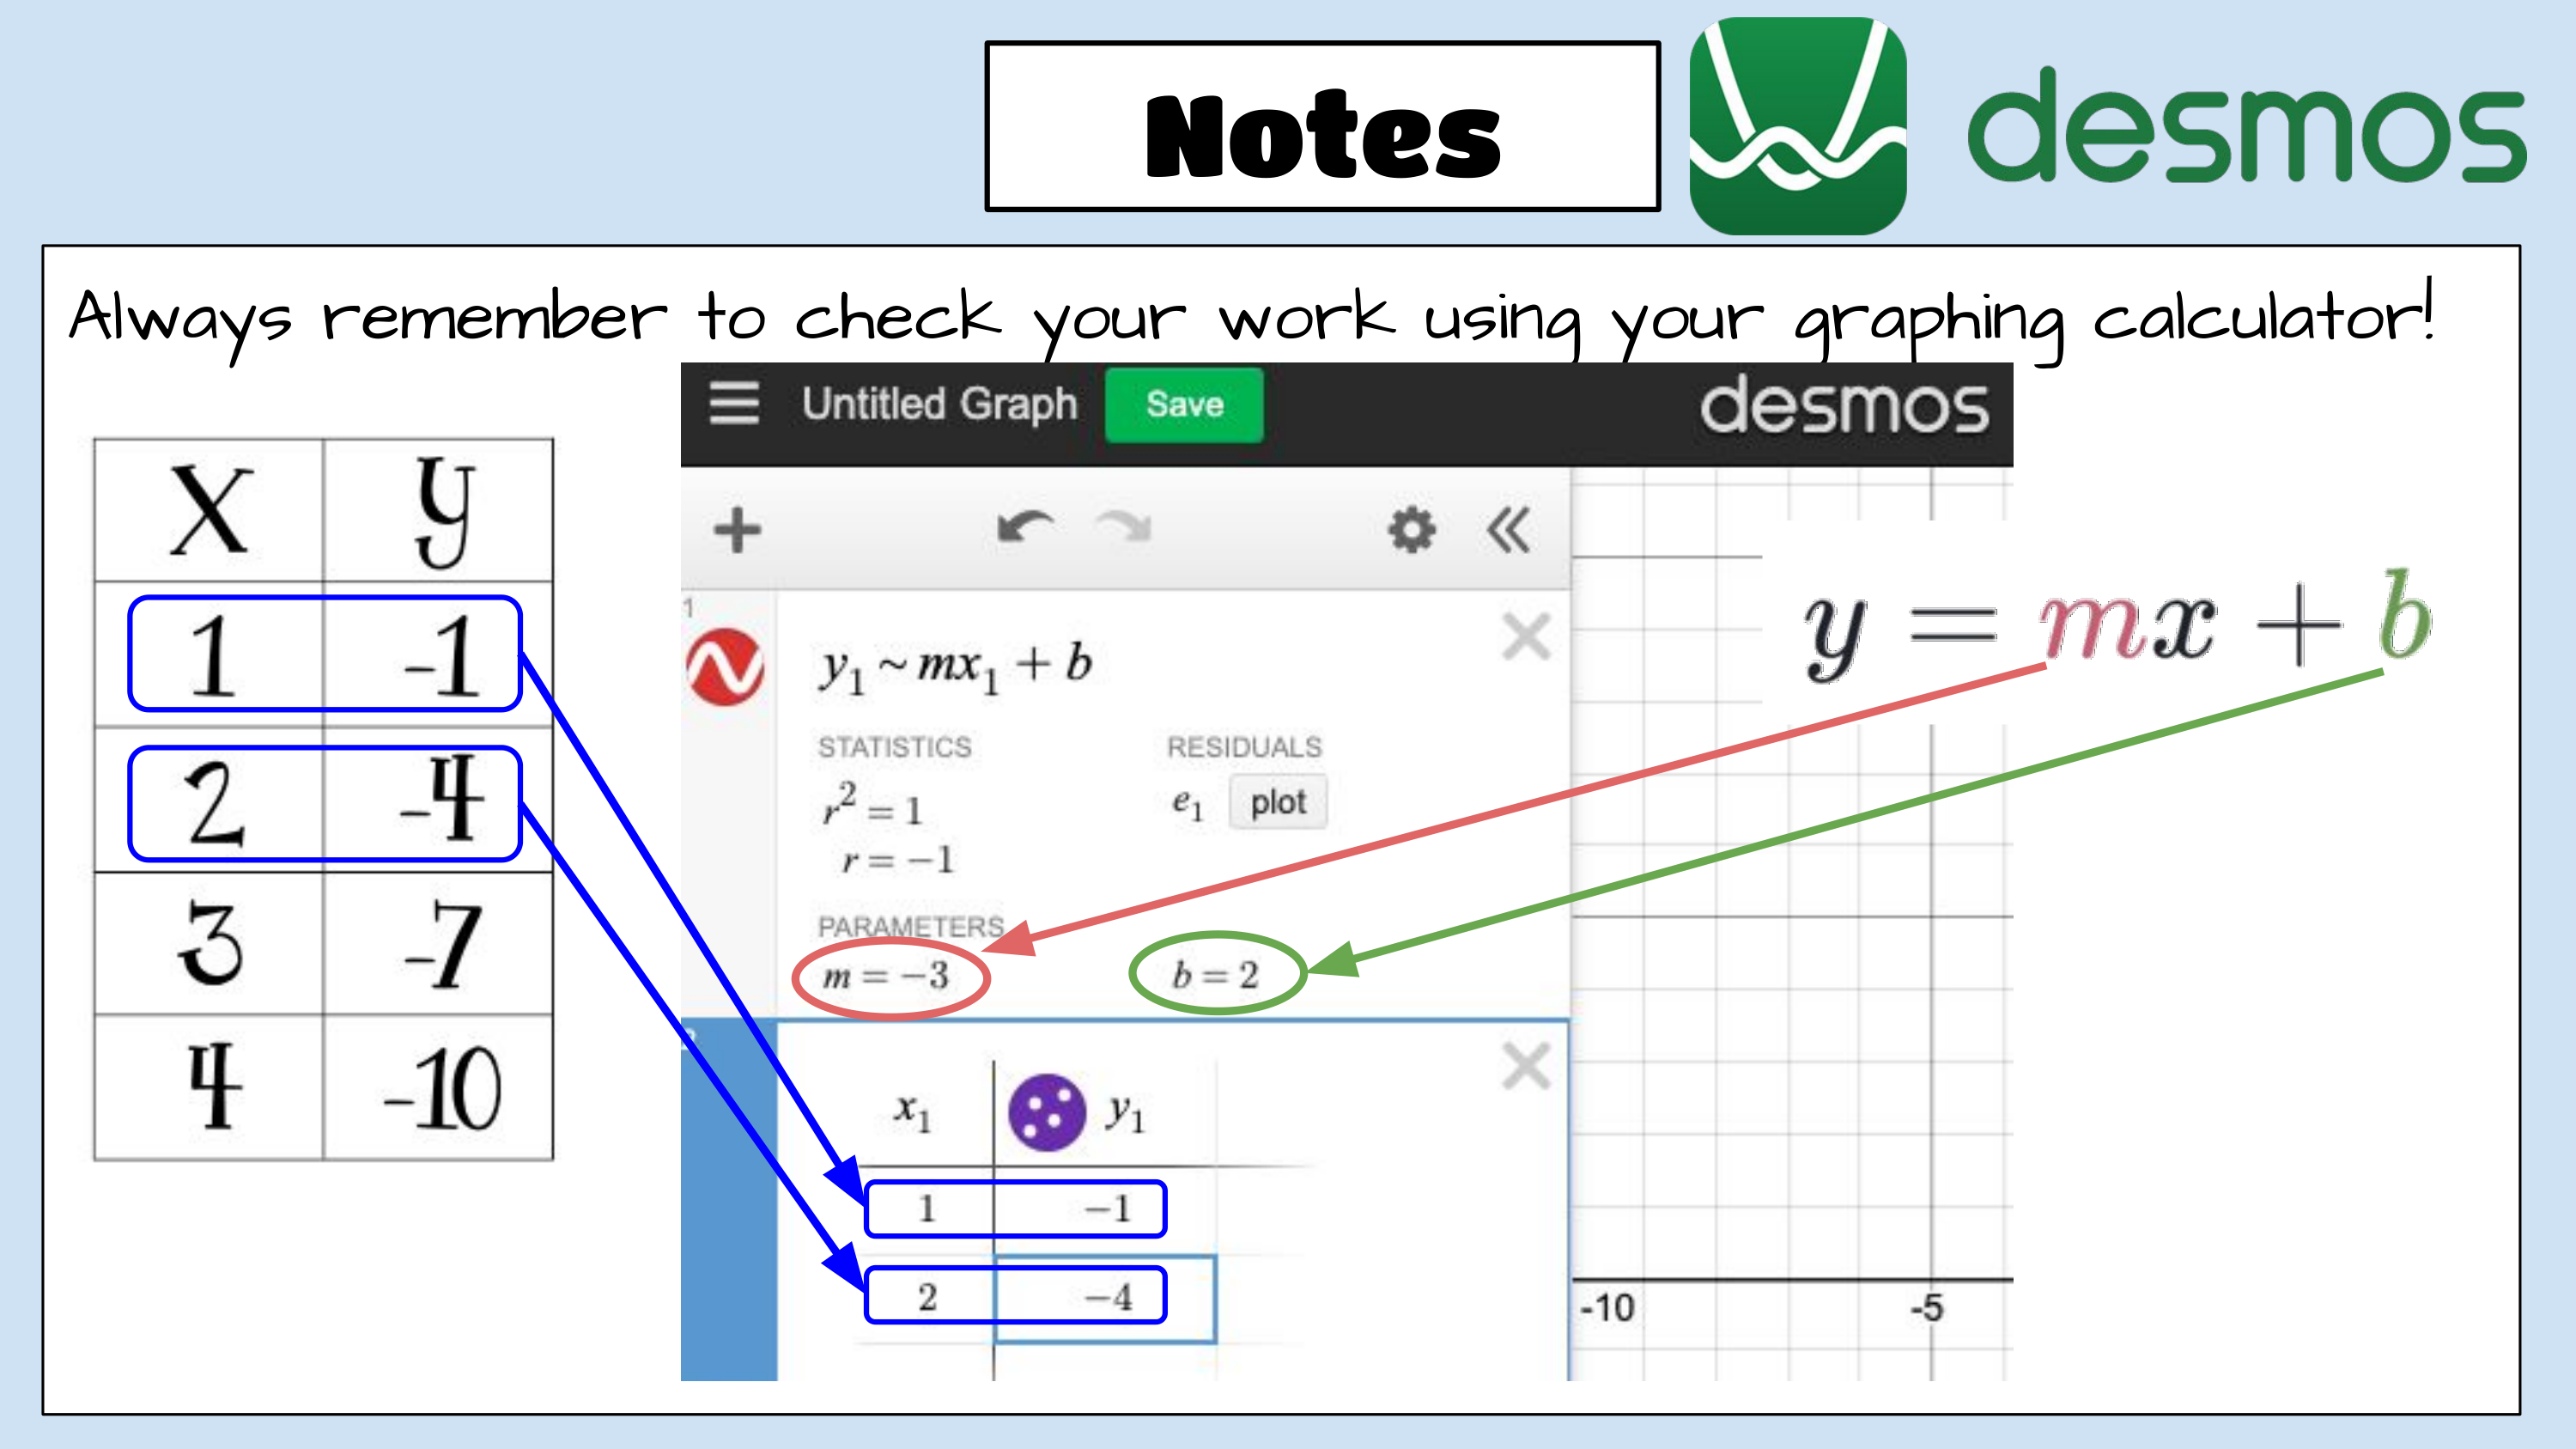
Based on the results from the graphing calculator, which option shows the slope?
Based on the results from the graphing calculator, which option shows the slope?
Based on the results from the graphing calculator, which option shows the slope?
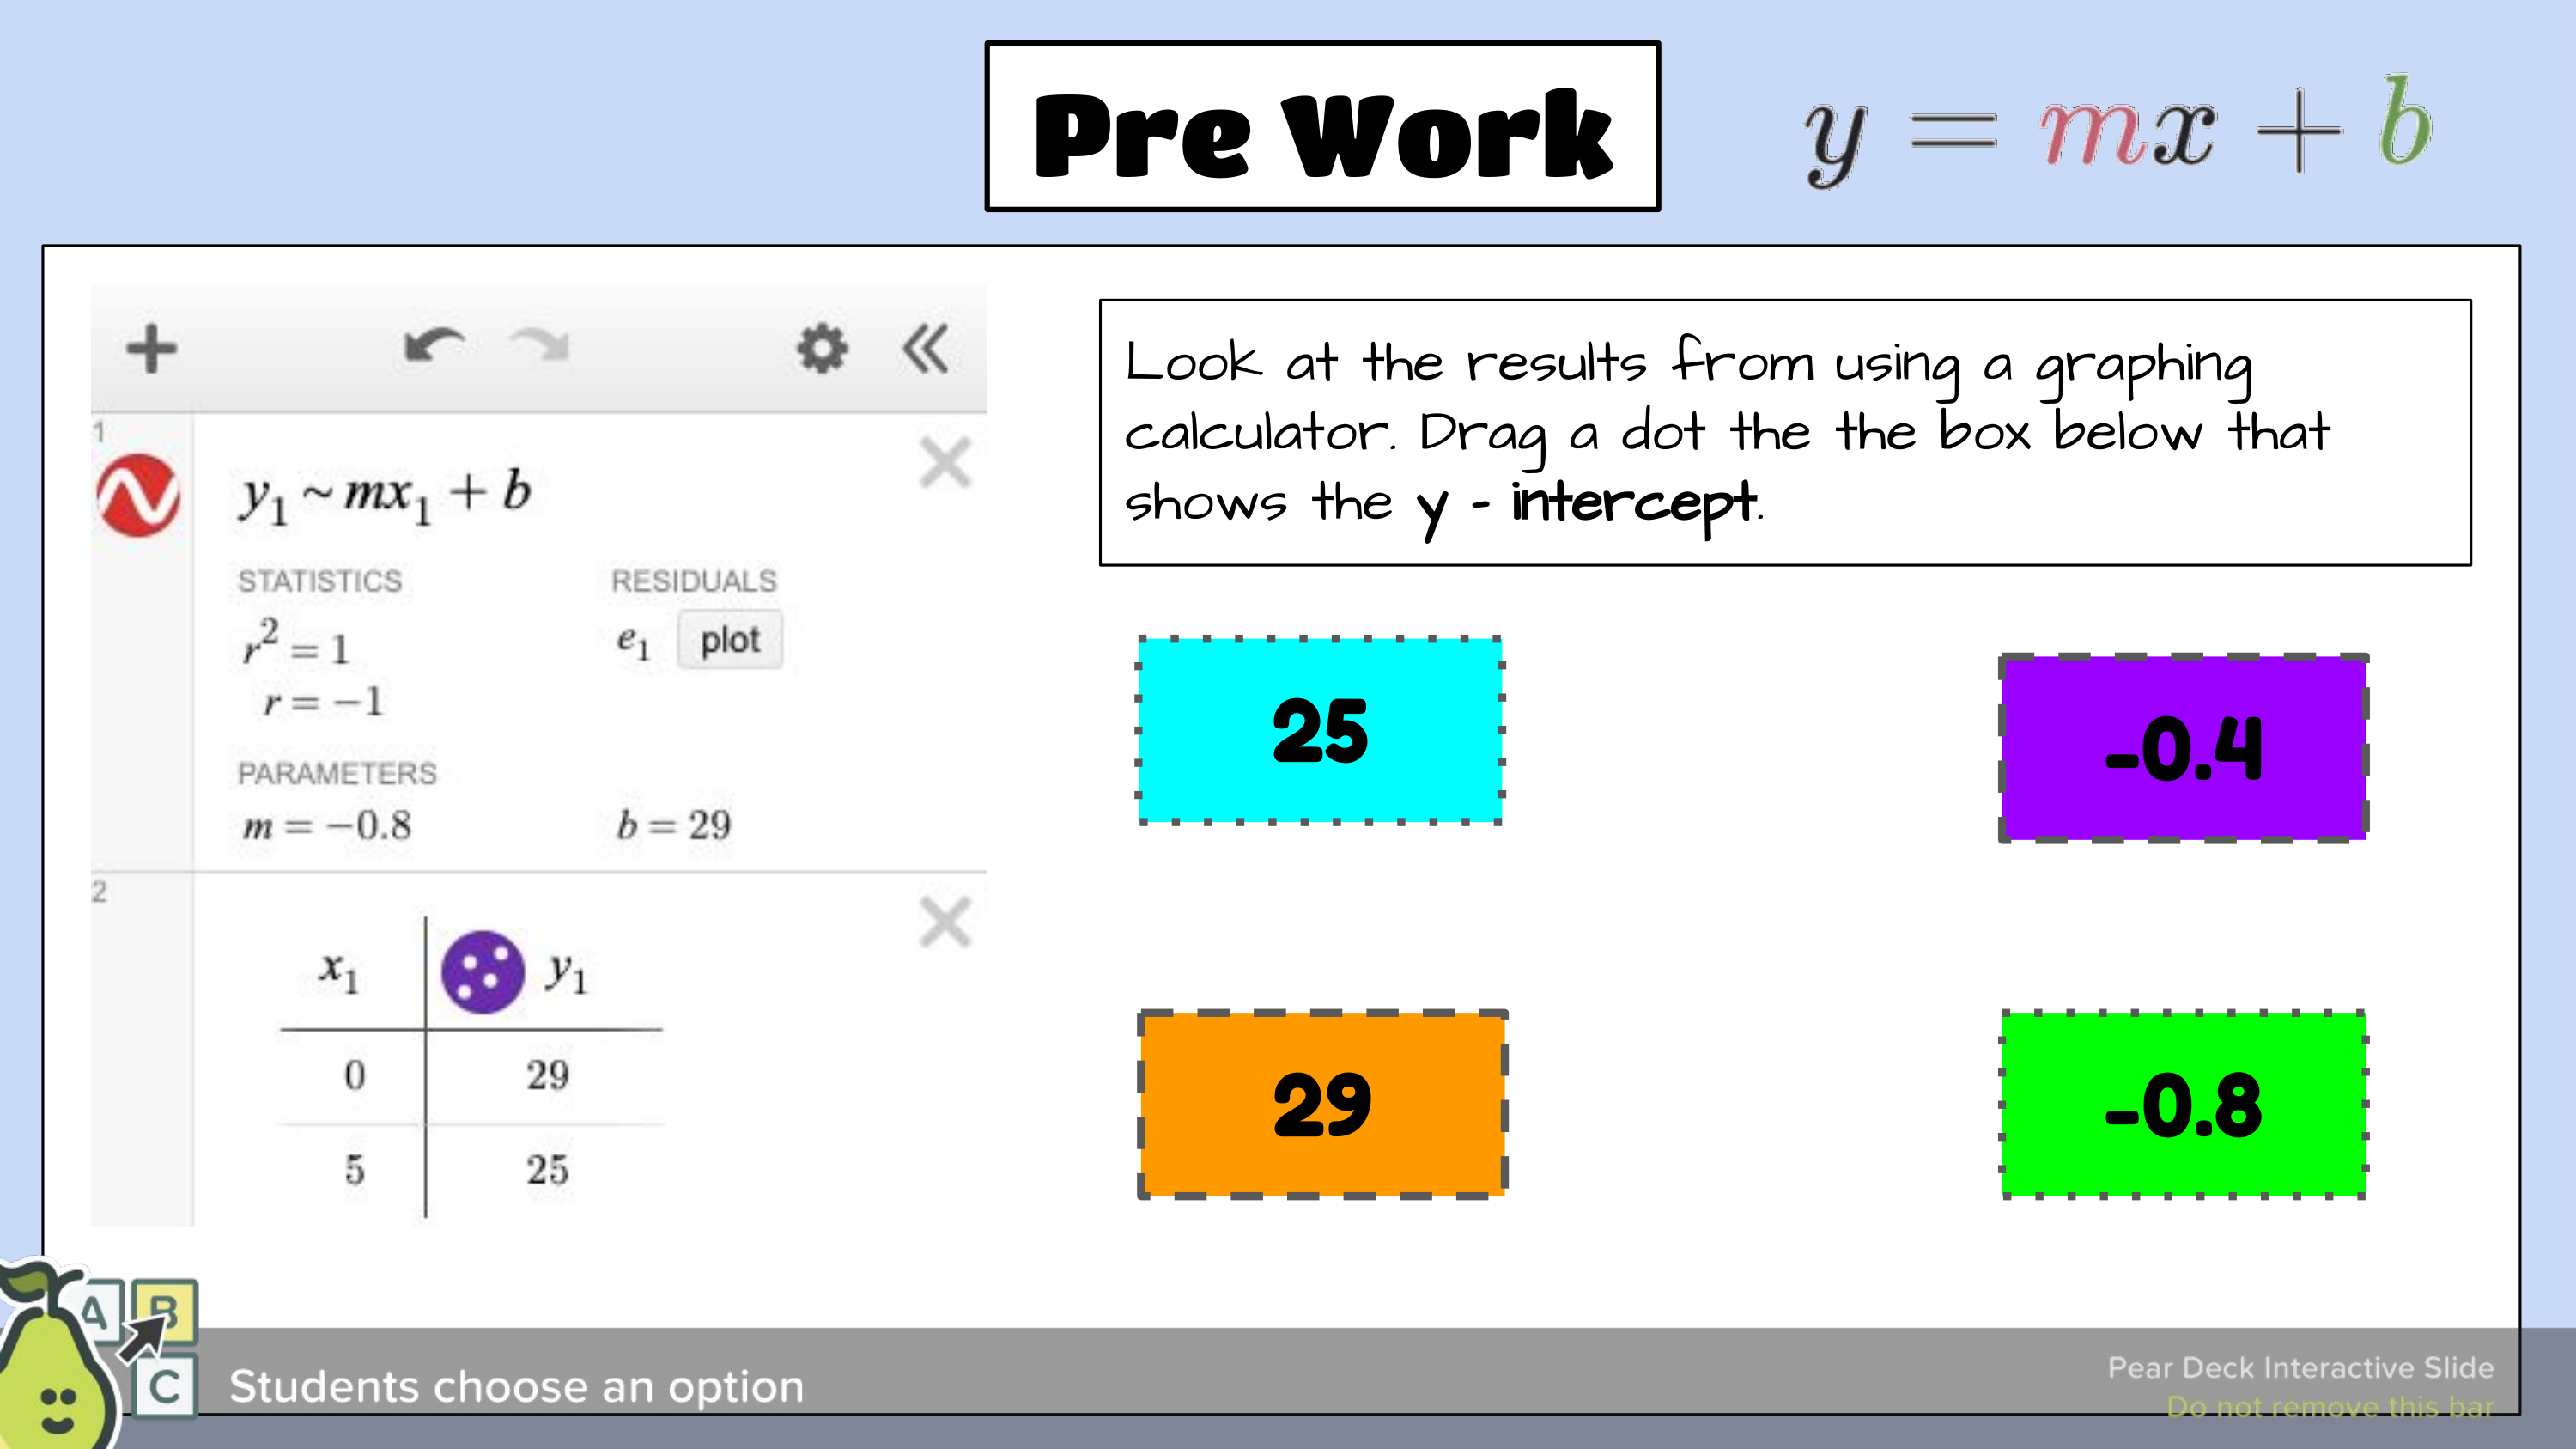
Based on the results from the graphing calculator, which option shows the y-intercept?
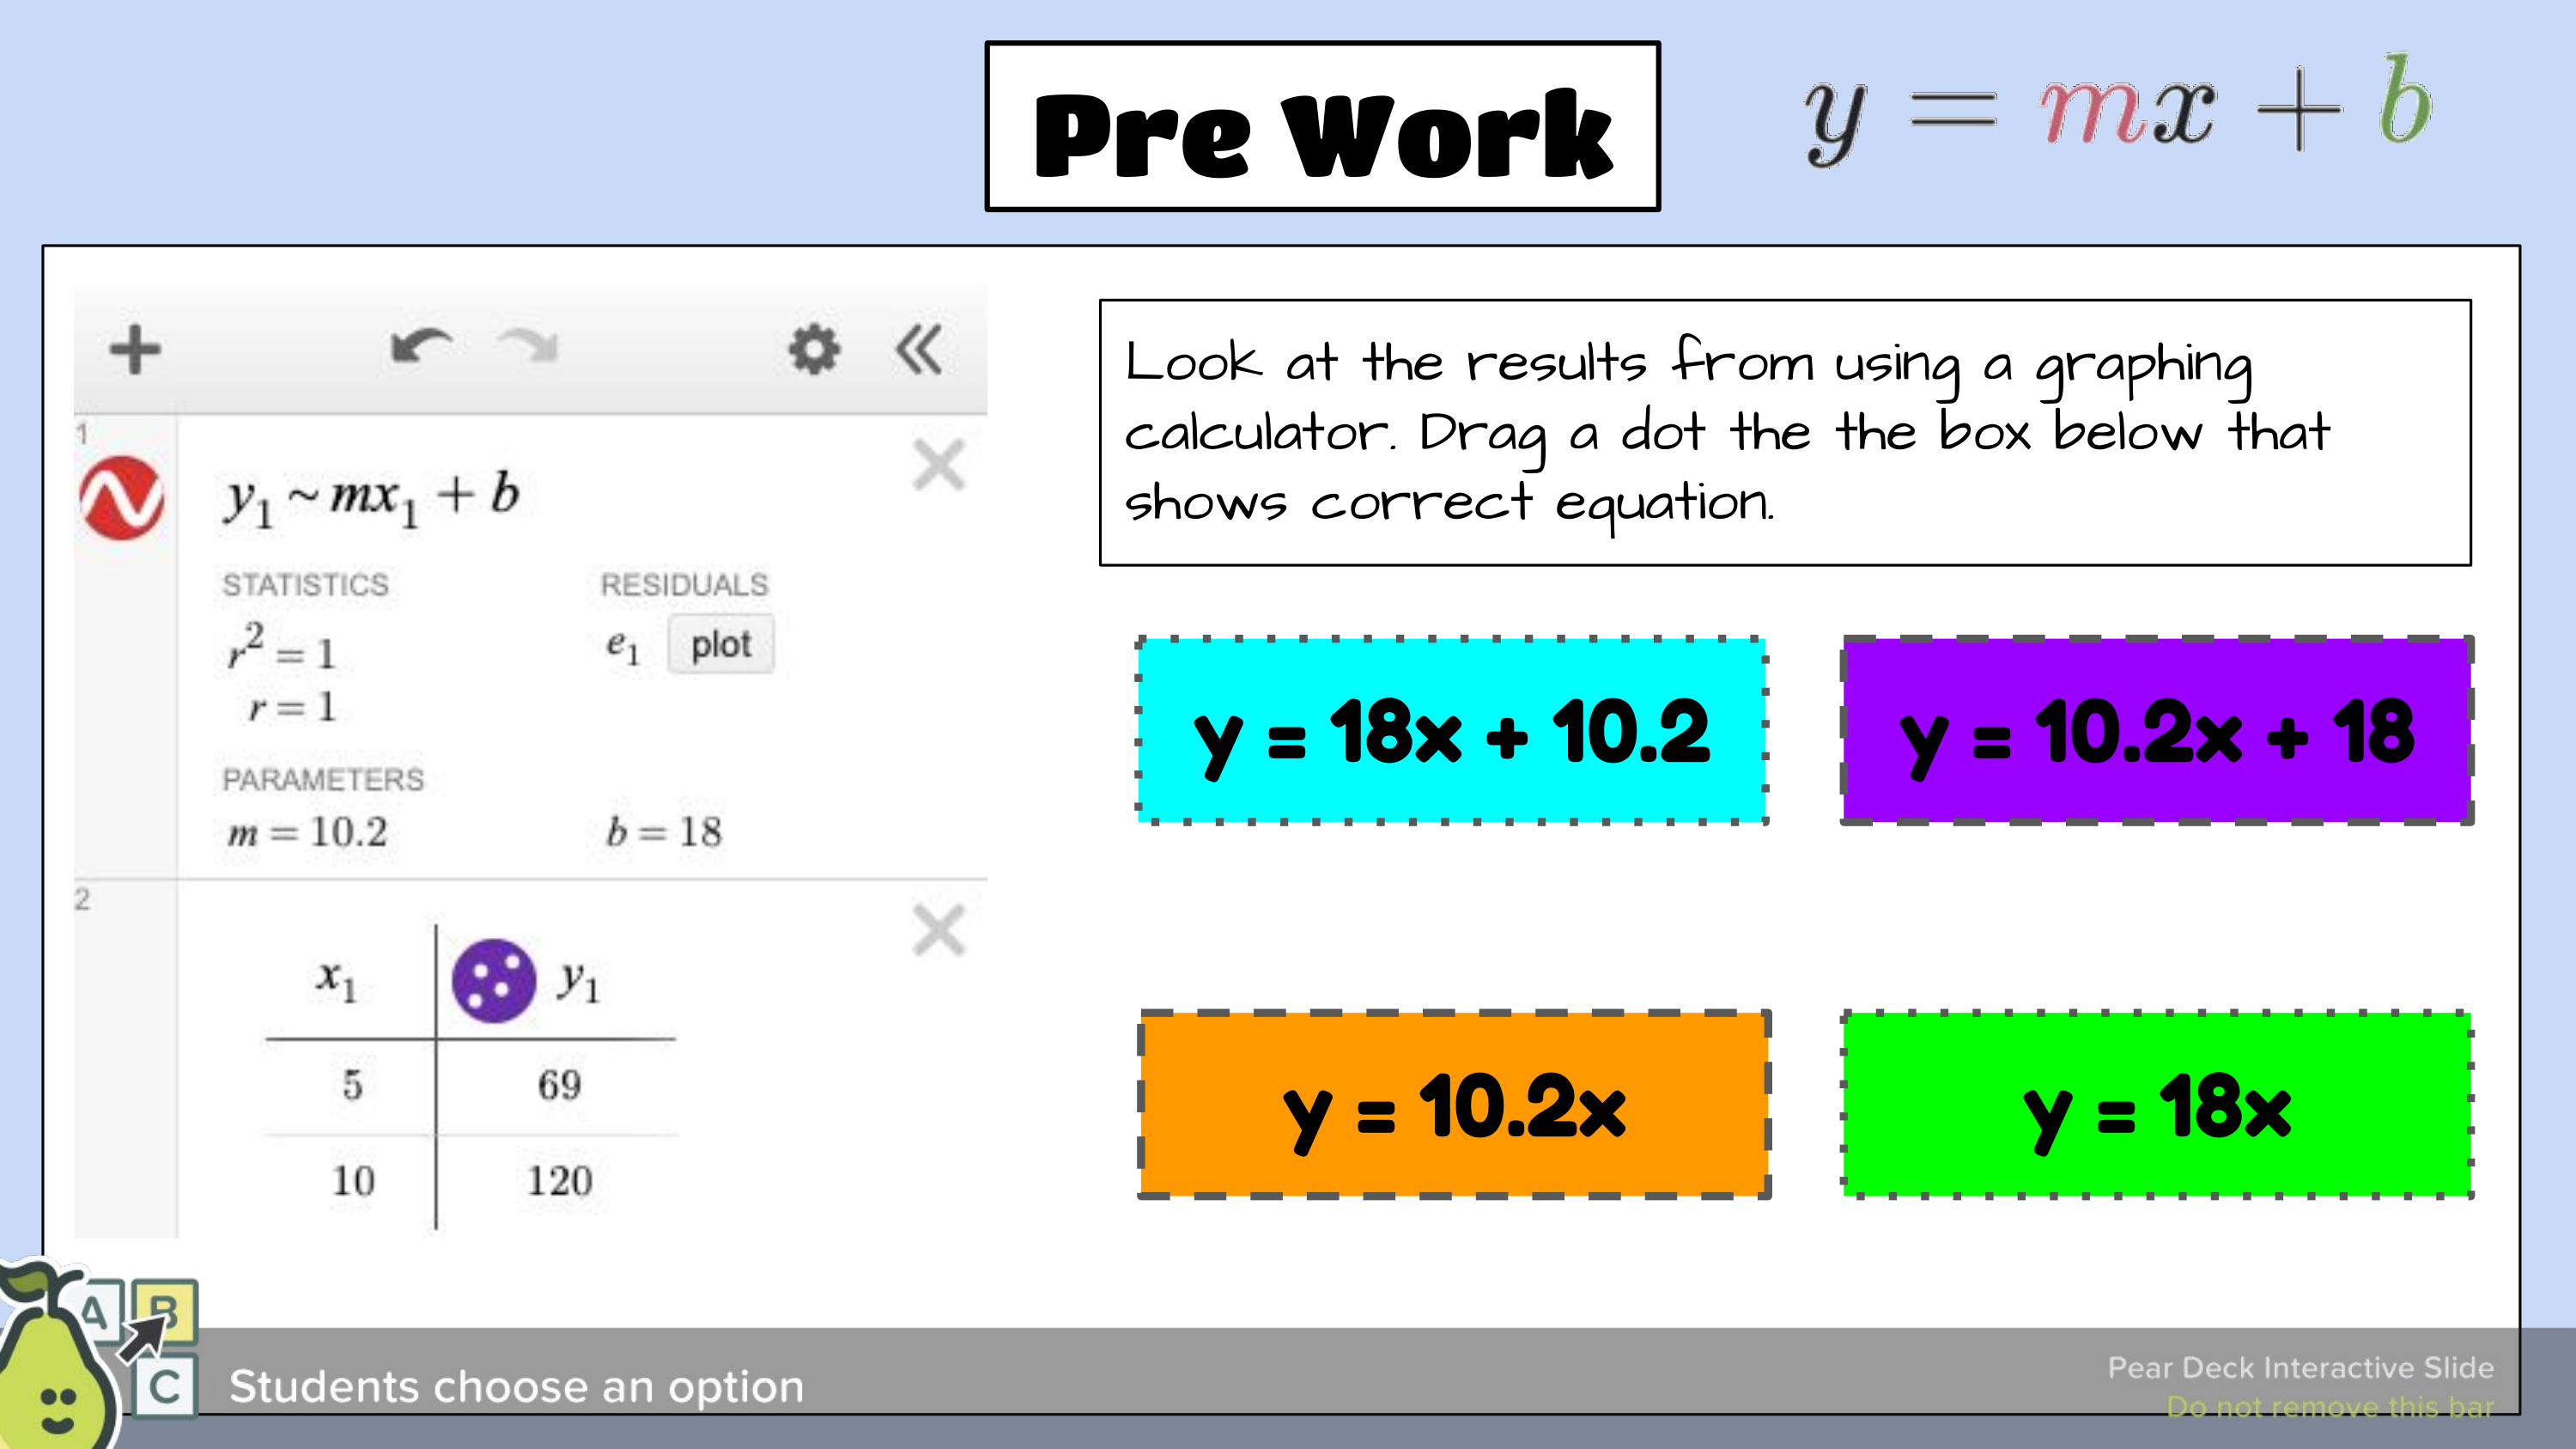
Based on the results from the graphing calculator, which option shows the correct equation?
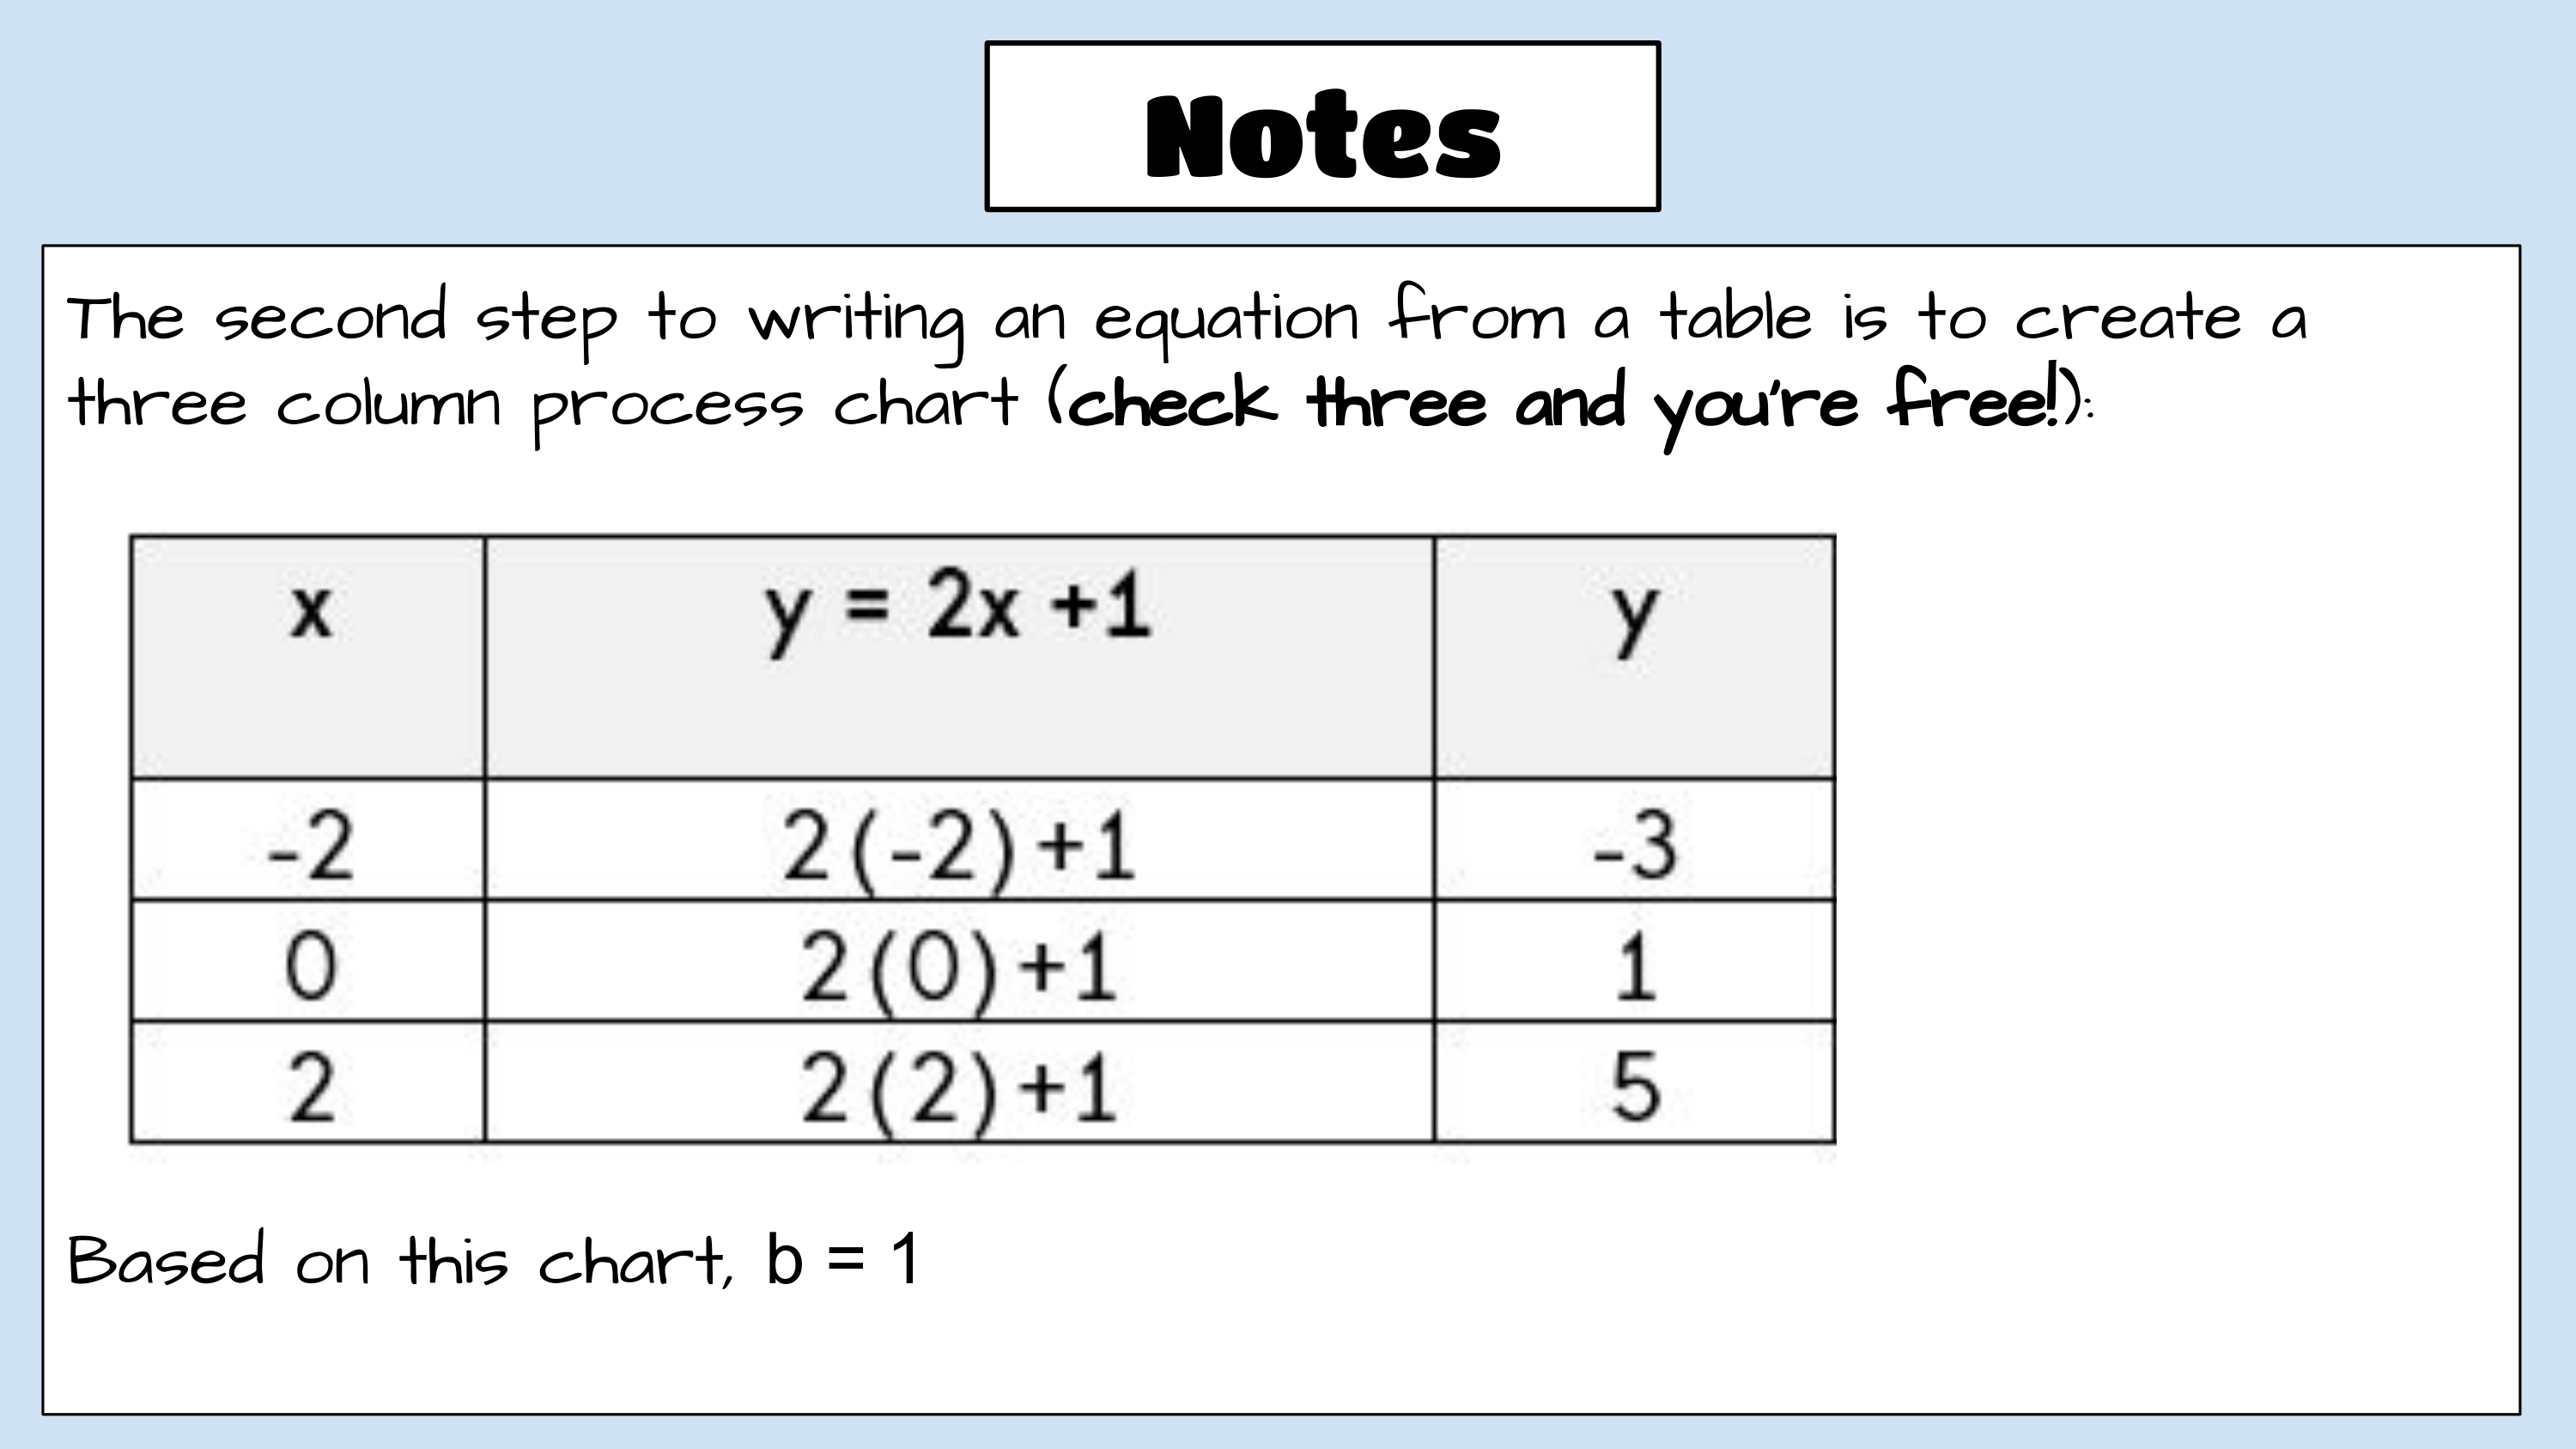
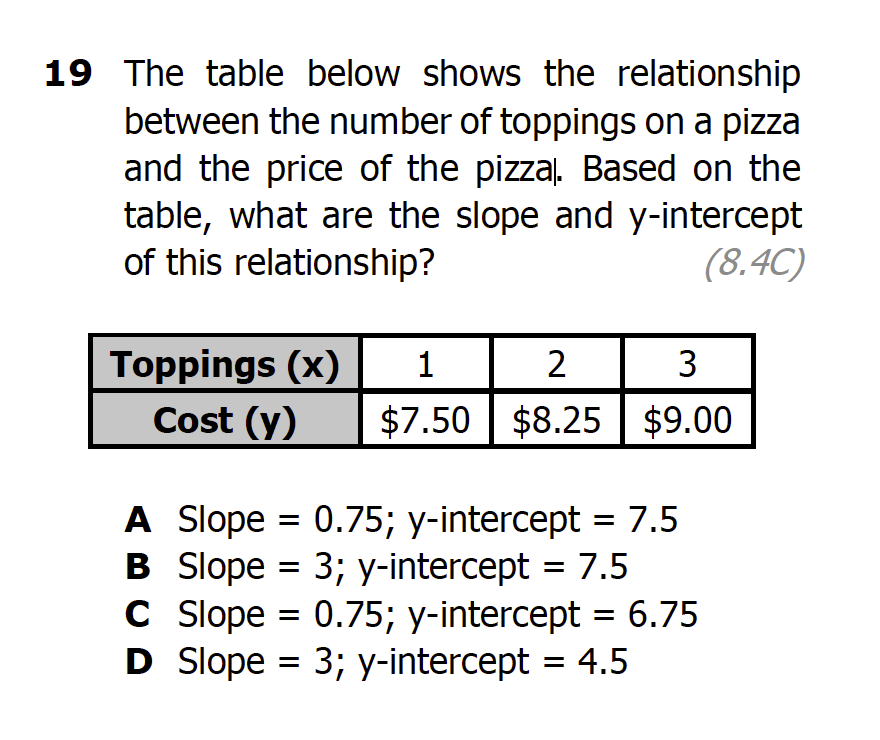
Success Criteria:
1. I can indentify wehther the relationship is proportional or non-proportional.
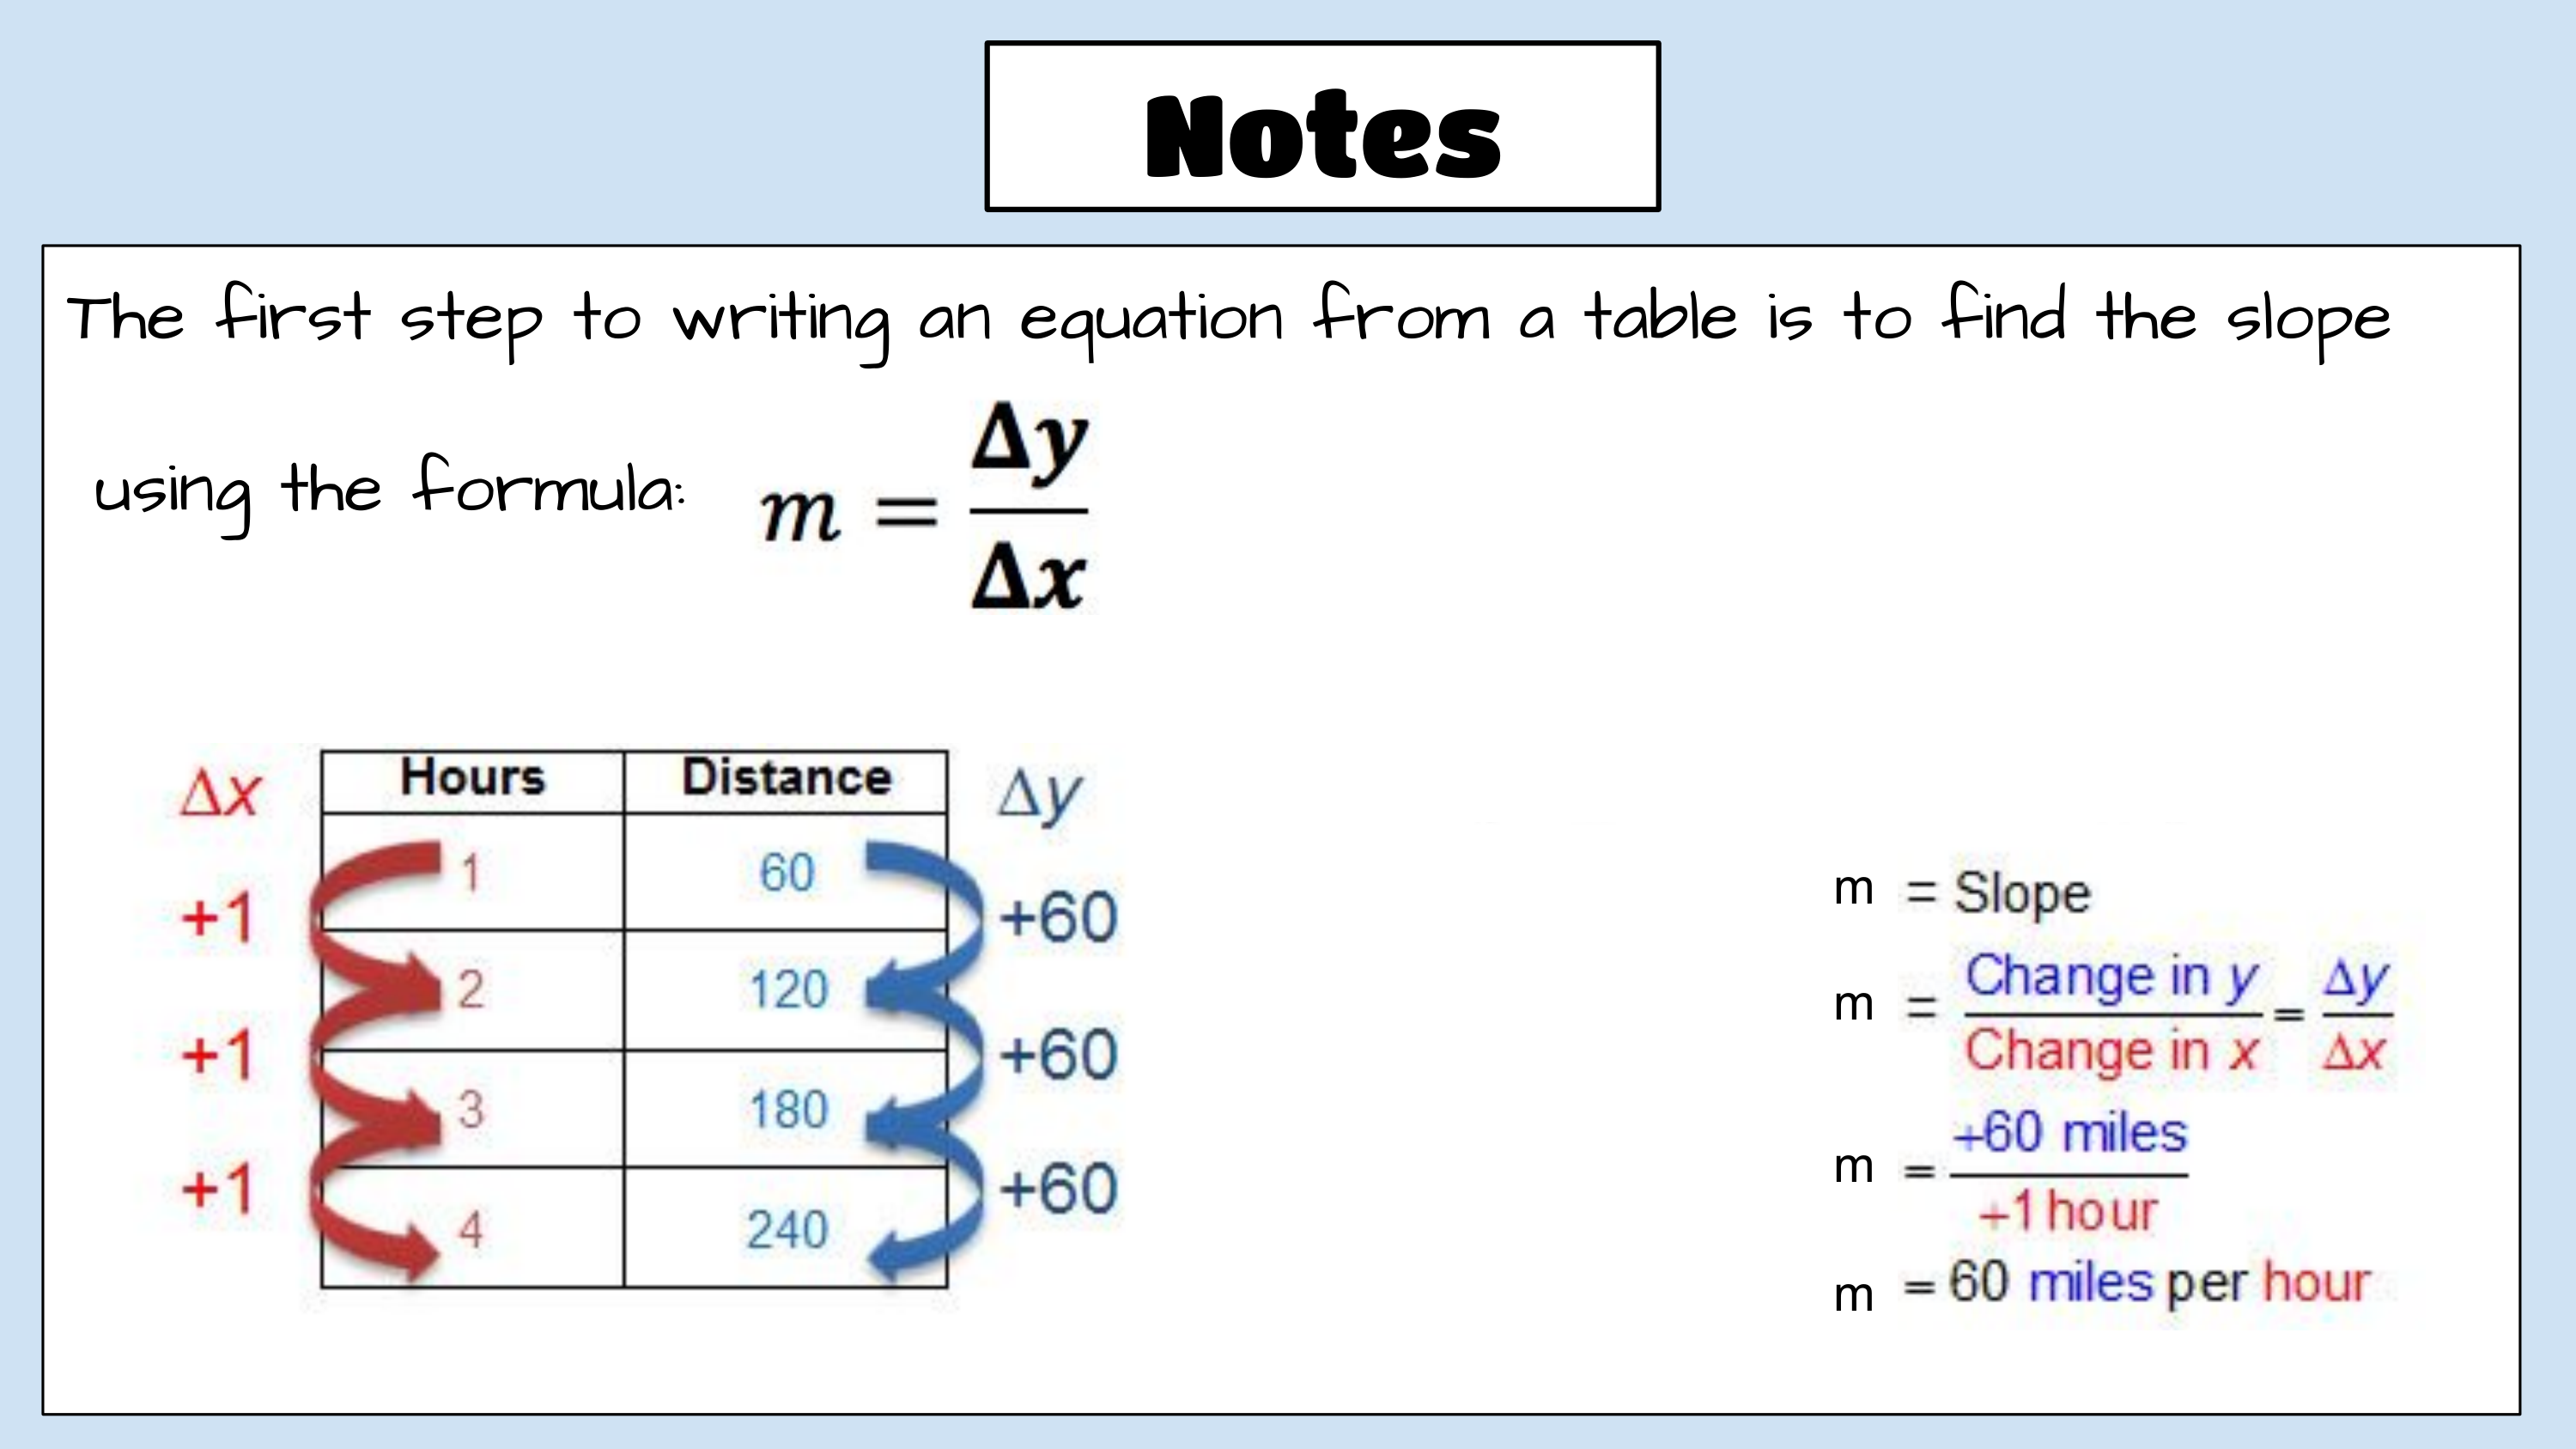
2. I can calculate the slope in the given relationship.
3. I can calculate the y-intercept in the given relationship.
4. I can create a summary of the slope, y-intercept, or equation for the given relationship.
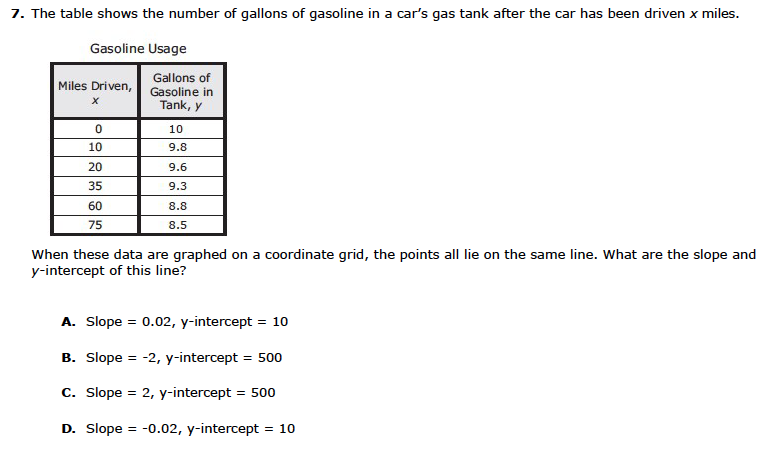
Success Criteria:
1. I can indentify wehther the relationship is proportional or non-proportional.
2. I can calculate the slope in the given relationship.
3. I can calculate the y-intercept in the given relationship.
4. I can create a summary of the slope, y-intercept, or equation for the given relationship.
Success Criteria:
1. I can indentify wehther the relationship is proportional or non-proportional.
2. I can calculate the slope in the given relationship.
3. I can calculate the y-intercept in the given relationship.
4. I can create a summary of the slope, y-intercept, or equation for the given relationship.
Success Criteria:
1. I can indentify wehther the relationship is proportional or non-proportional.
2. I can calculate the slope in the given relationship.
3. I can calculate the y-intercept in the given relationship.
4. I can create a summary of the slope, y-intercept, or equation for the given relationship.
Success Criteria:
1. I can indentify wehther the relationship is proportional or non-proportional.
2. I can calculate the slope in the given relationship.
3. I can calculate the y-intercept in the given relationship.
4. I can create a summary of the slope, y-intercept, or equation for the given relationship.
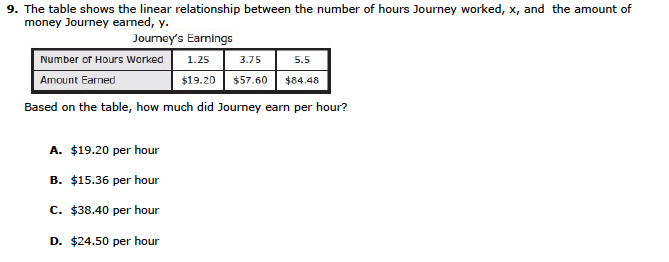
Does the table show a proportional relationship?
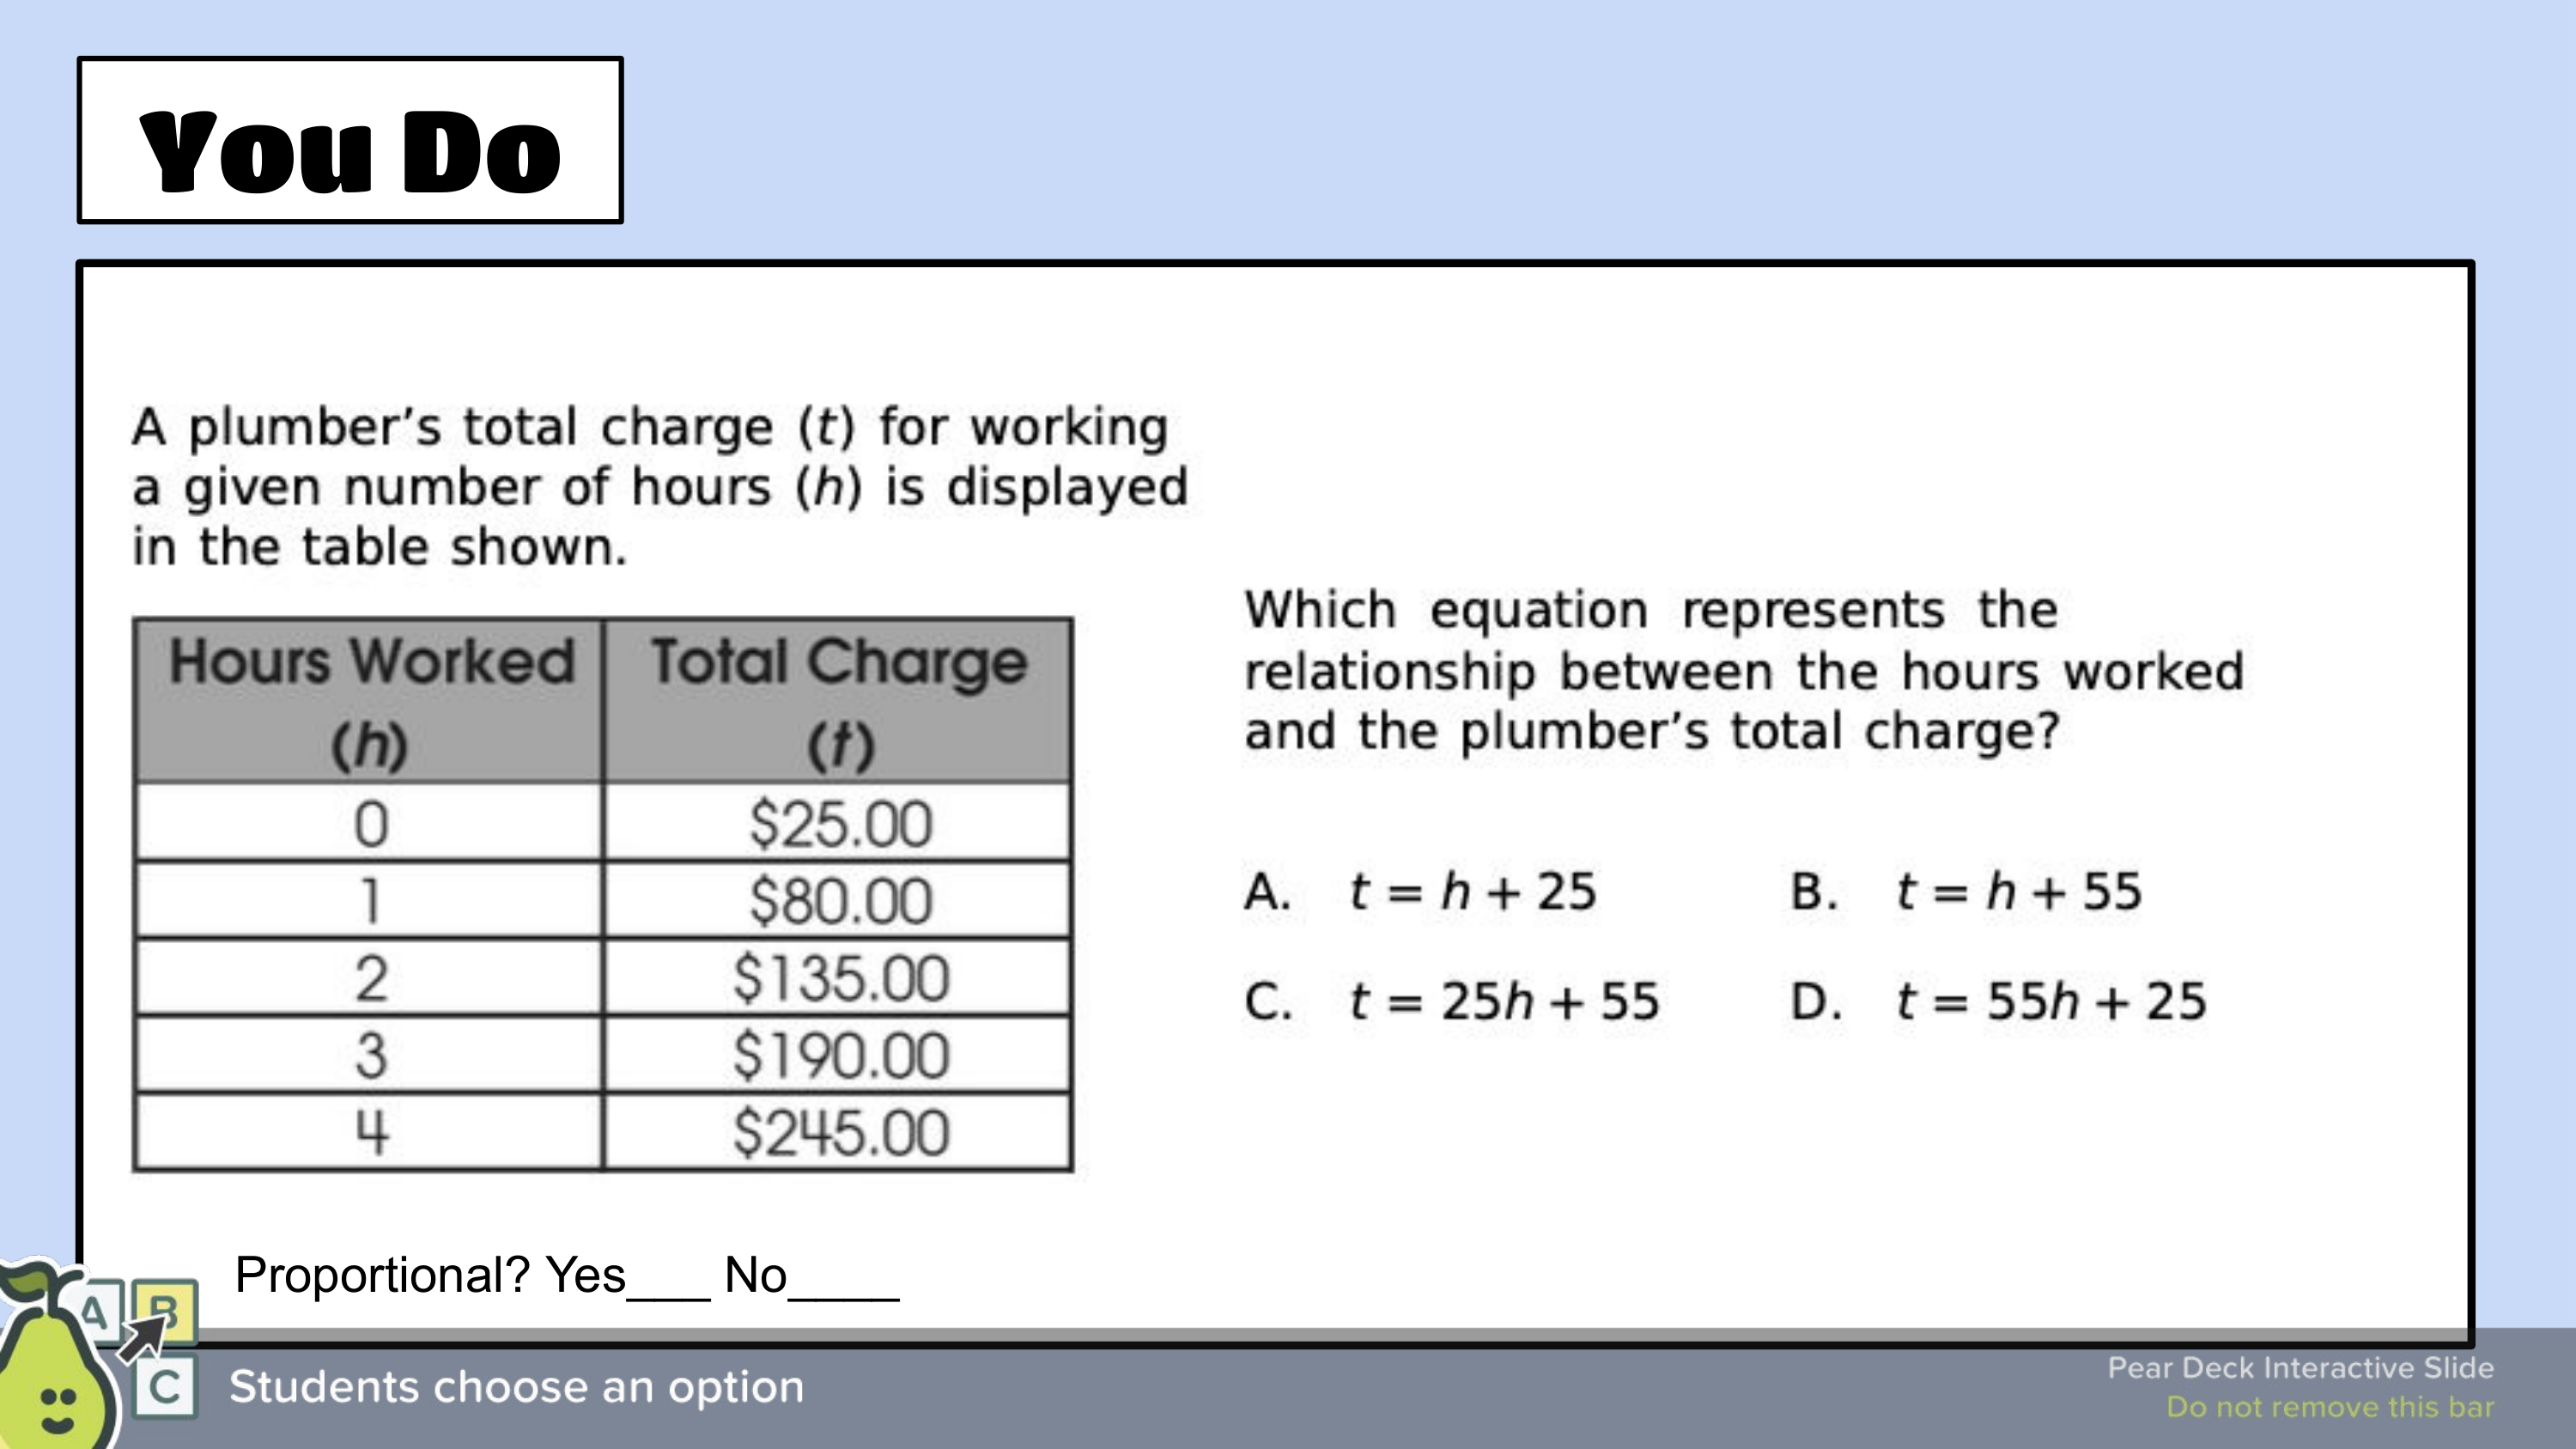
Does the table show a proportional relationship?
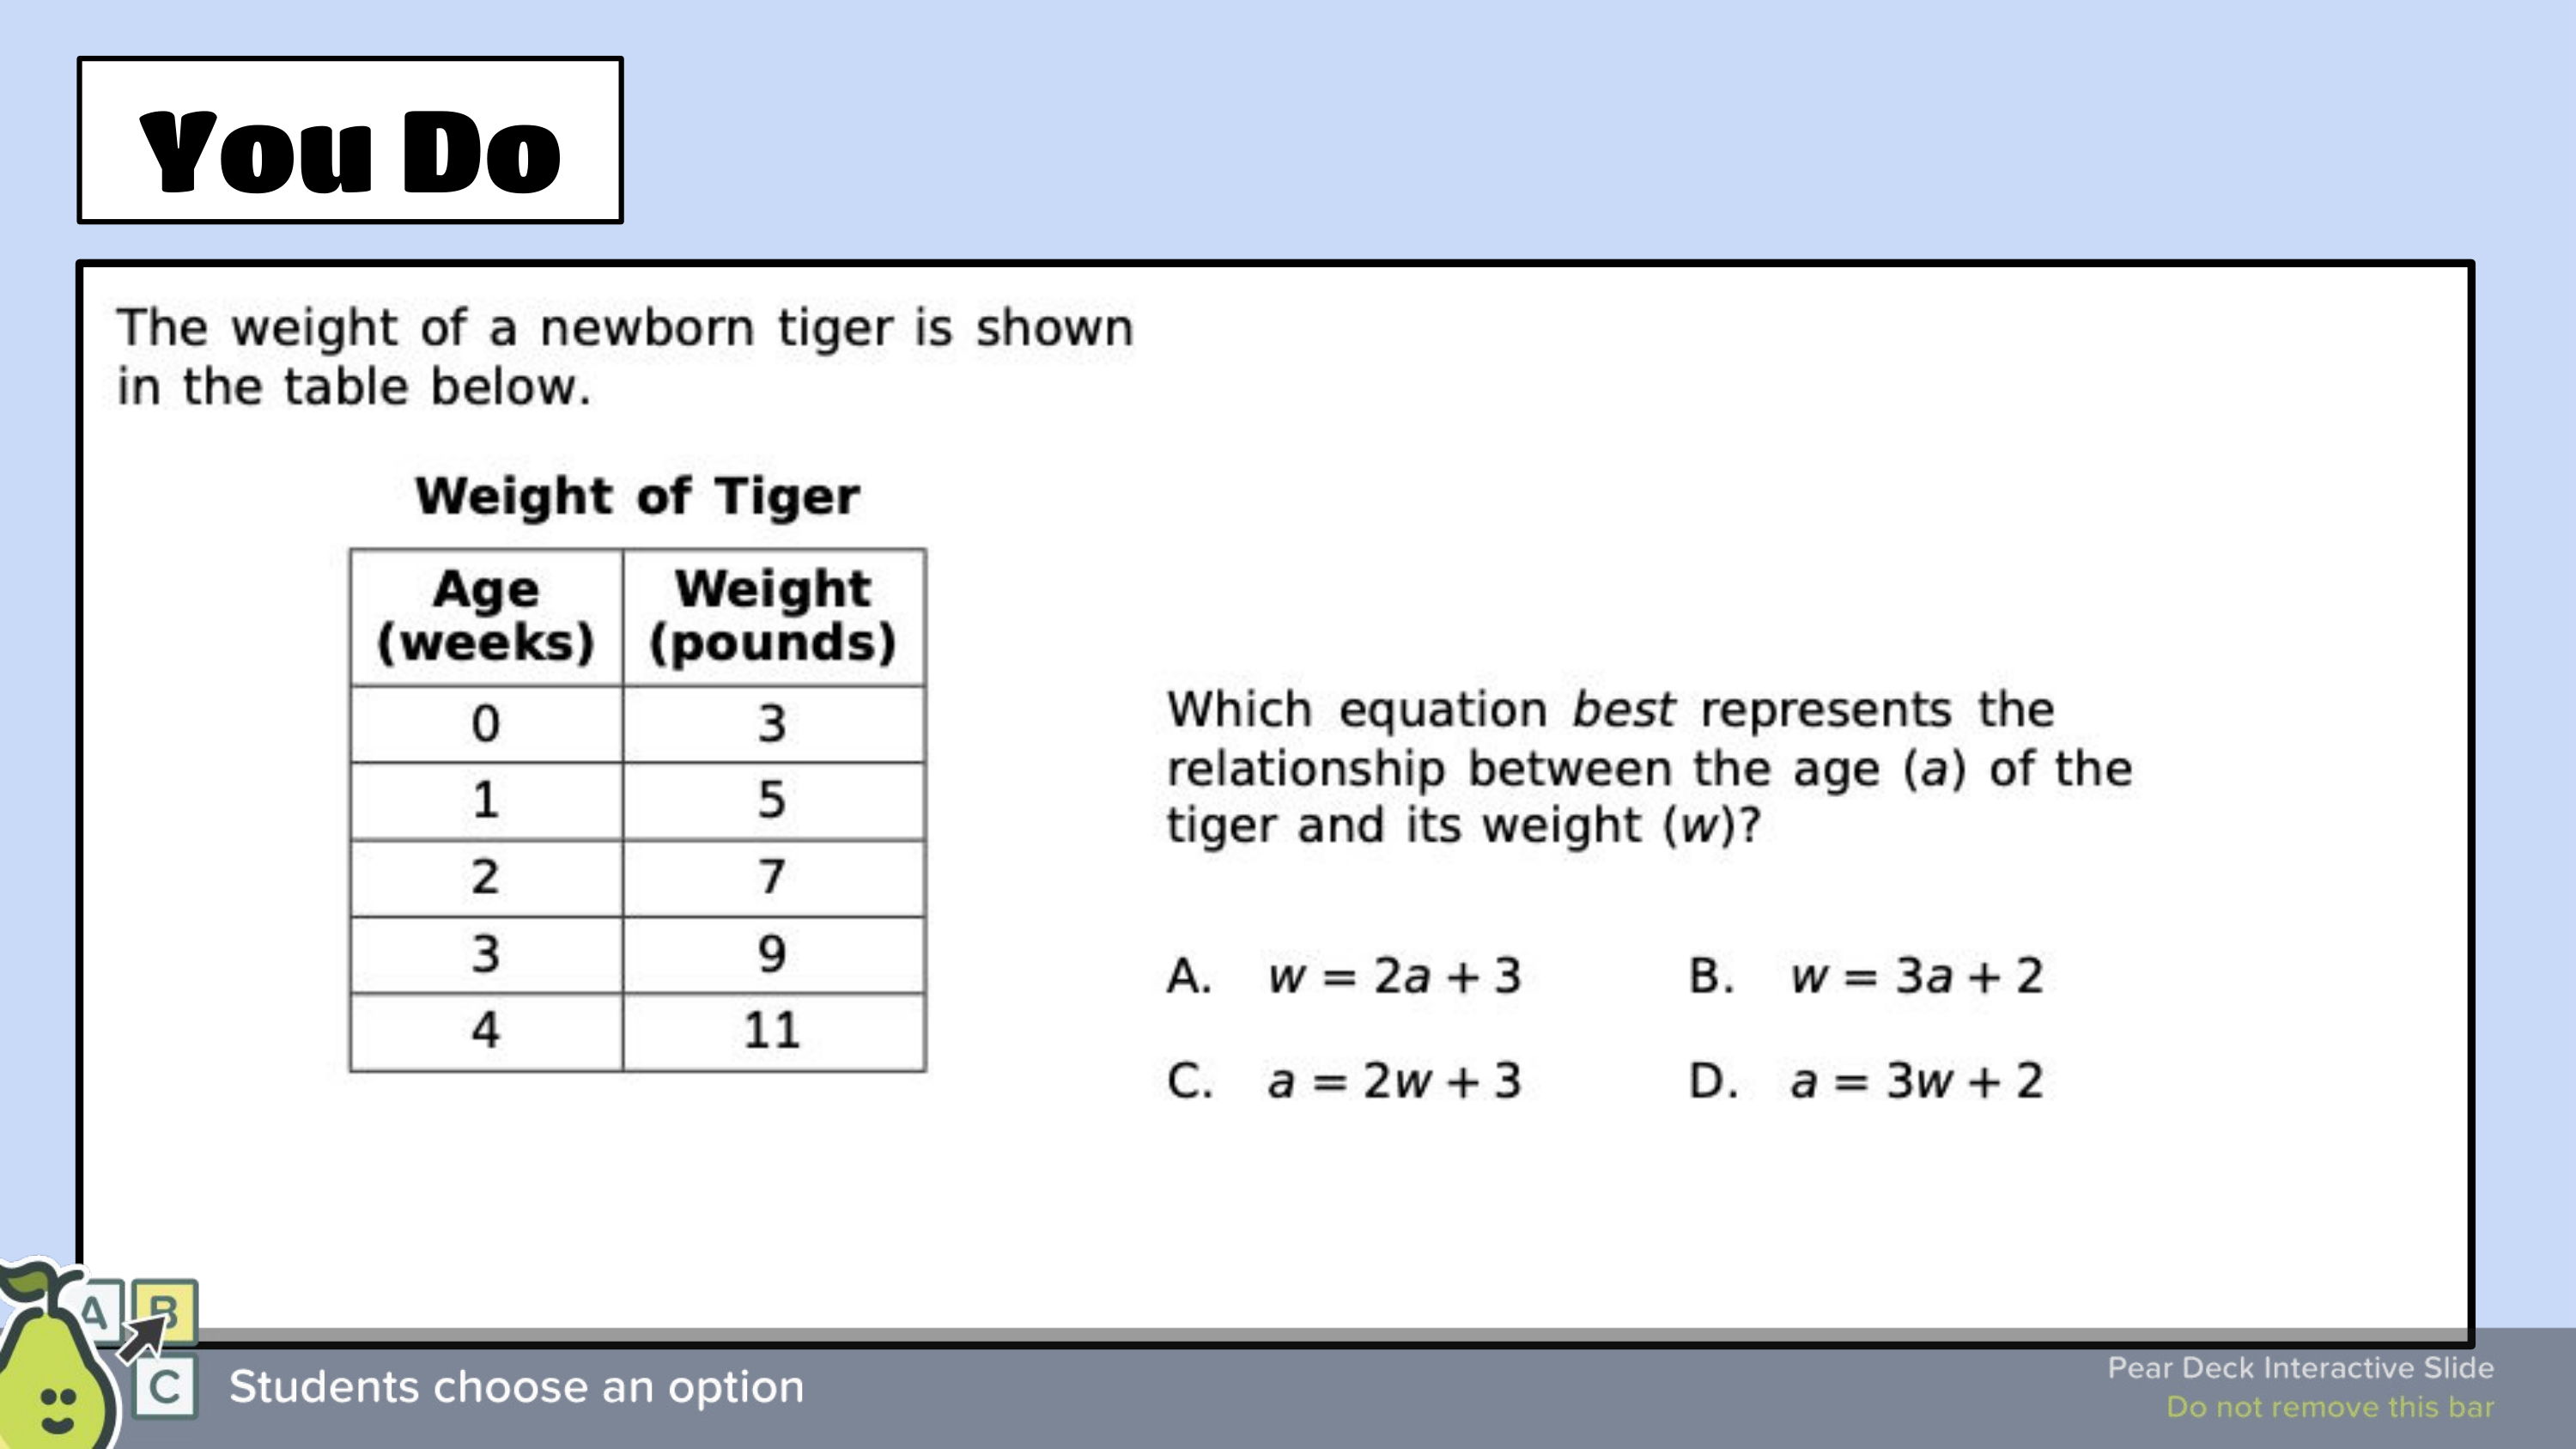
Look at the table. Is the relationship propoortional?
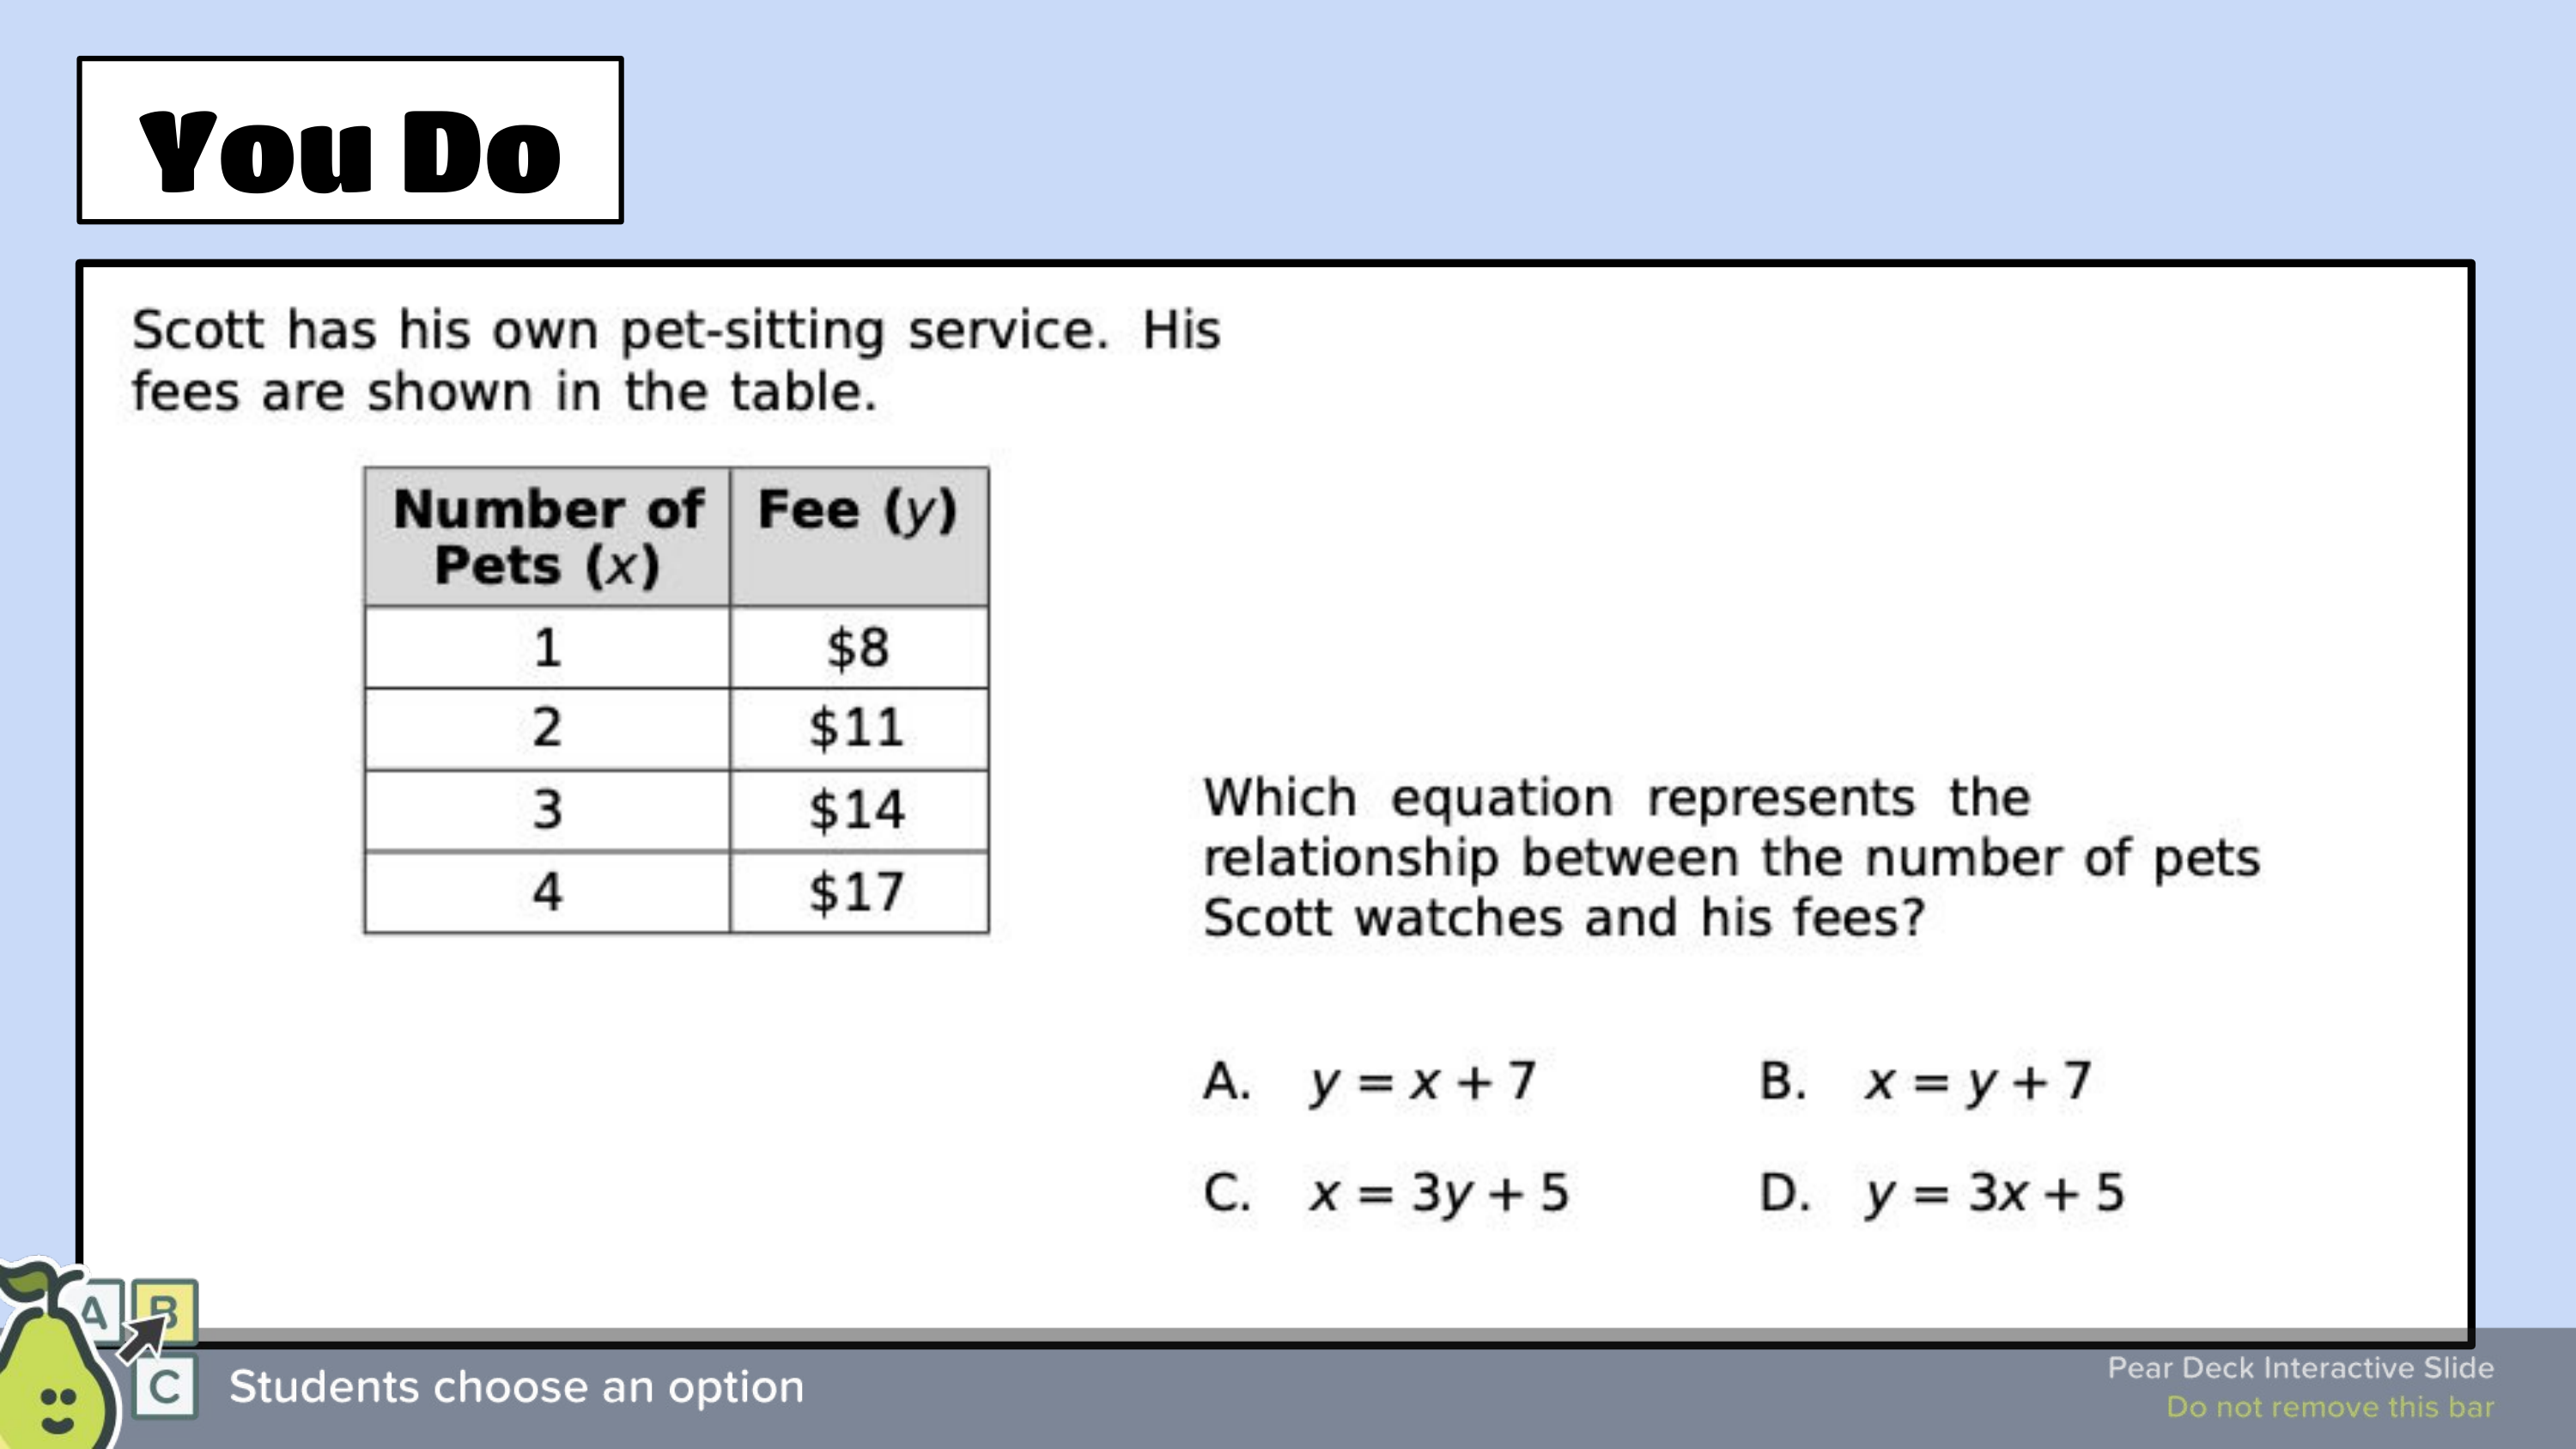
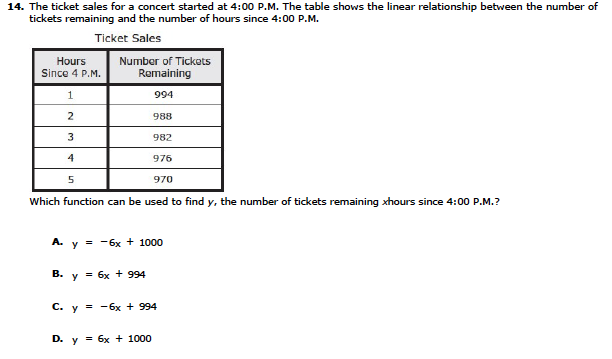
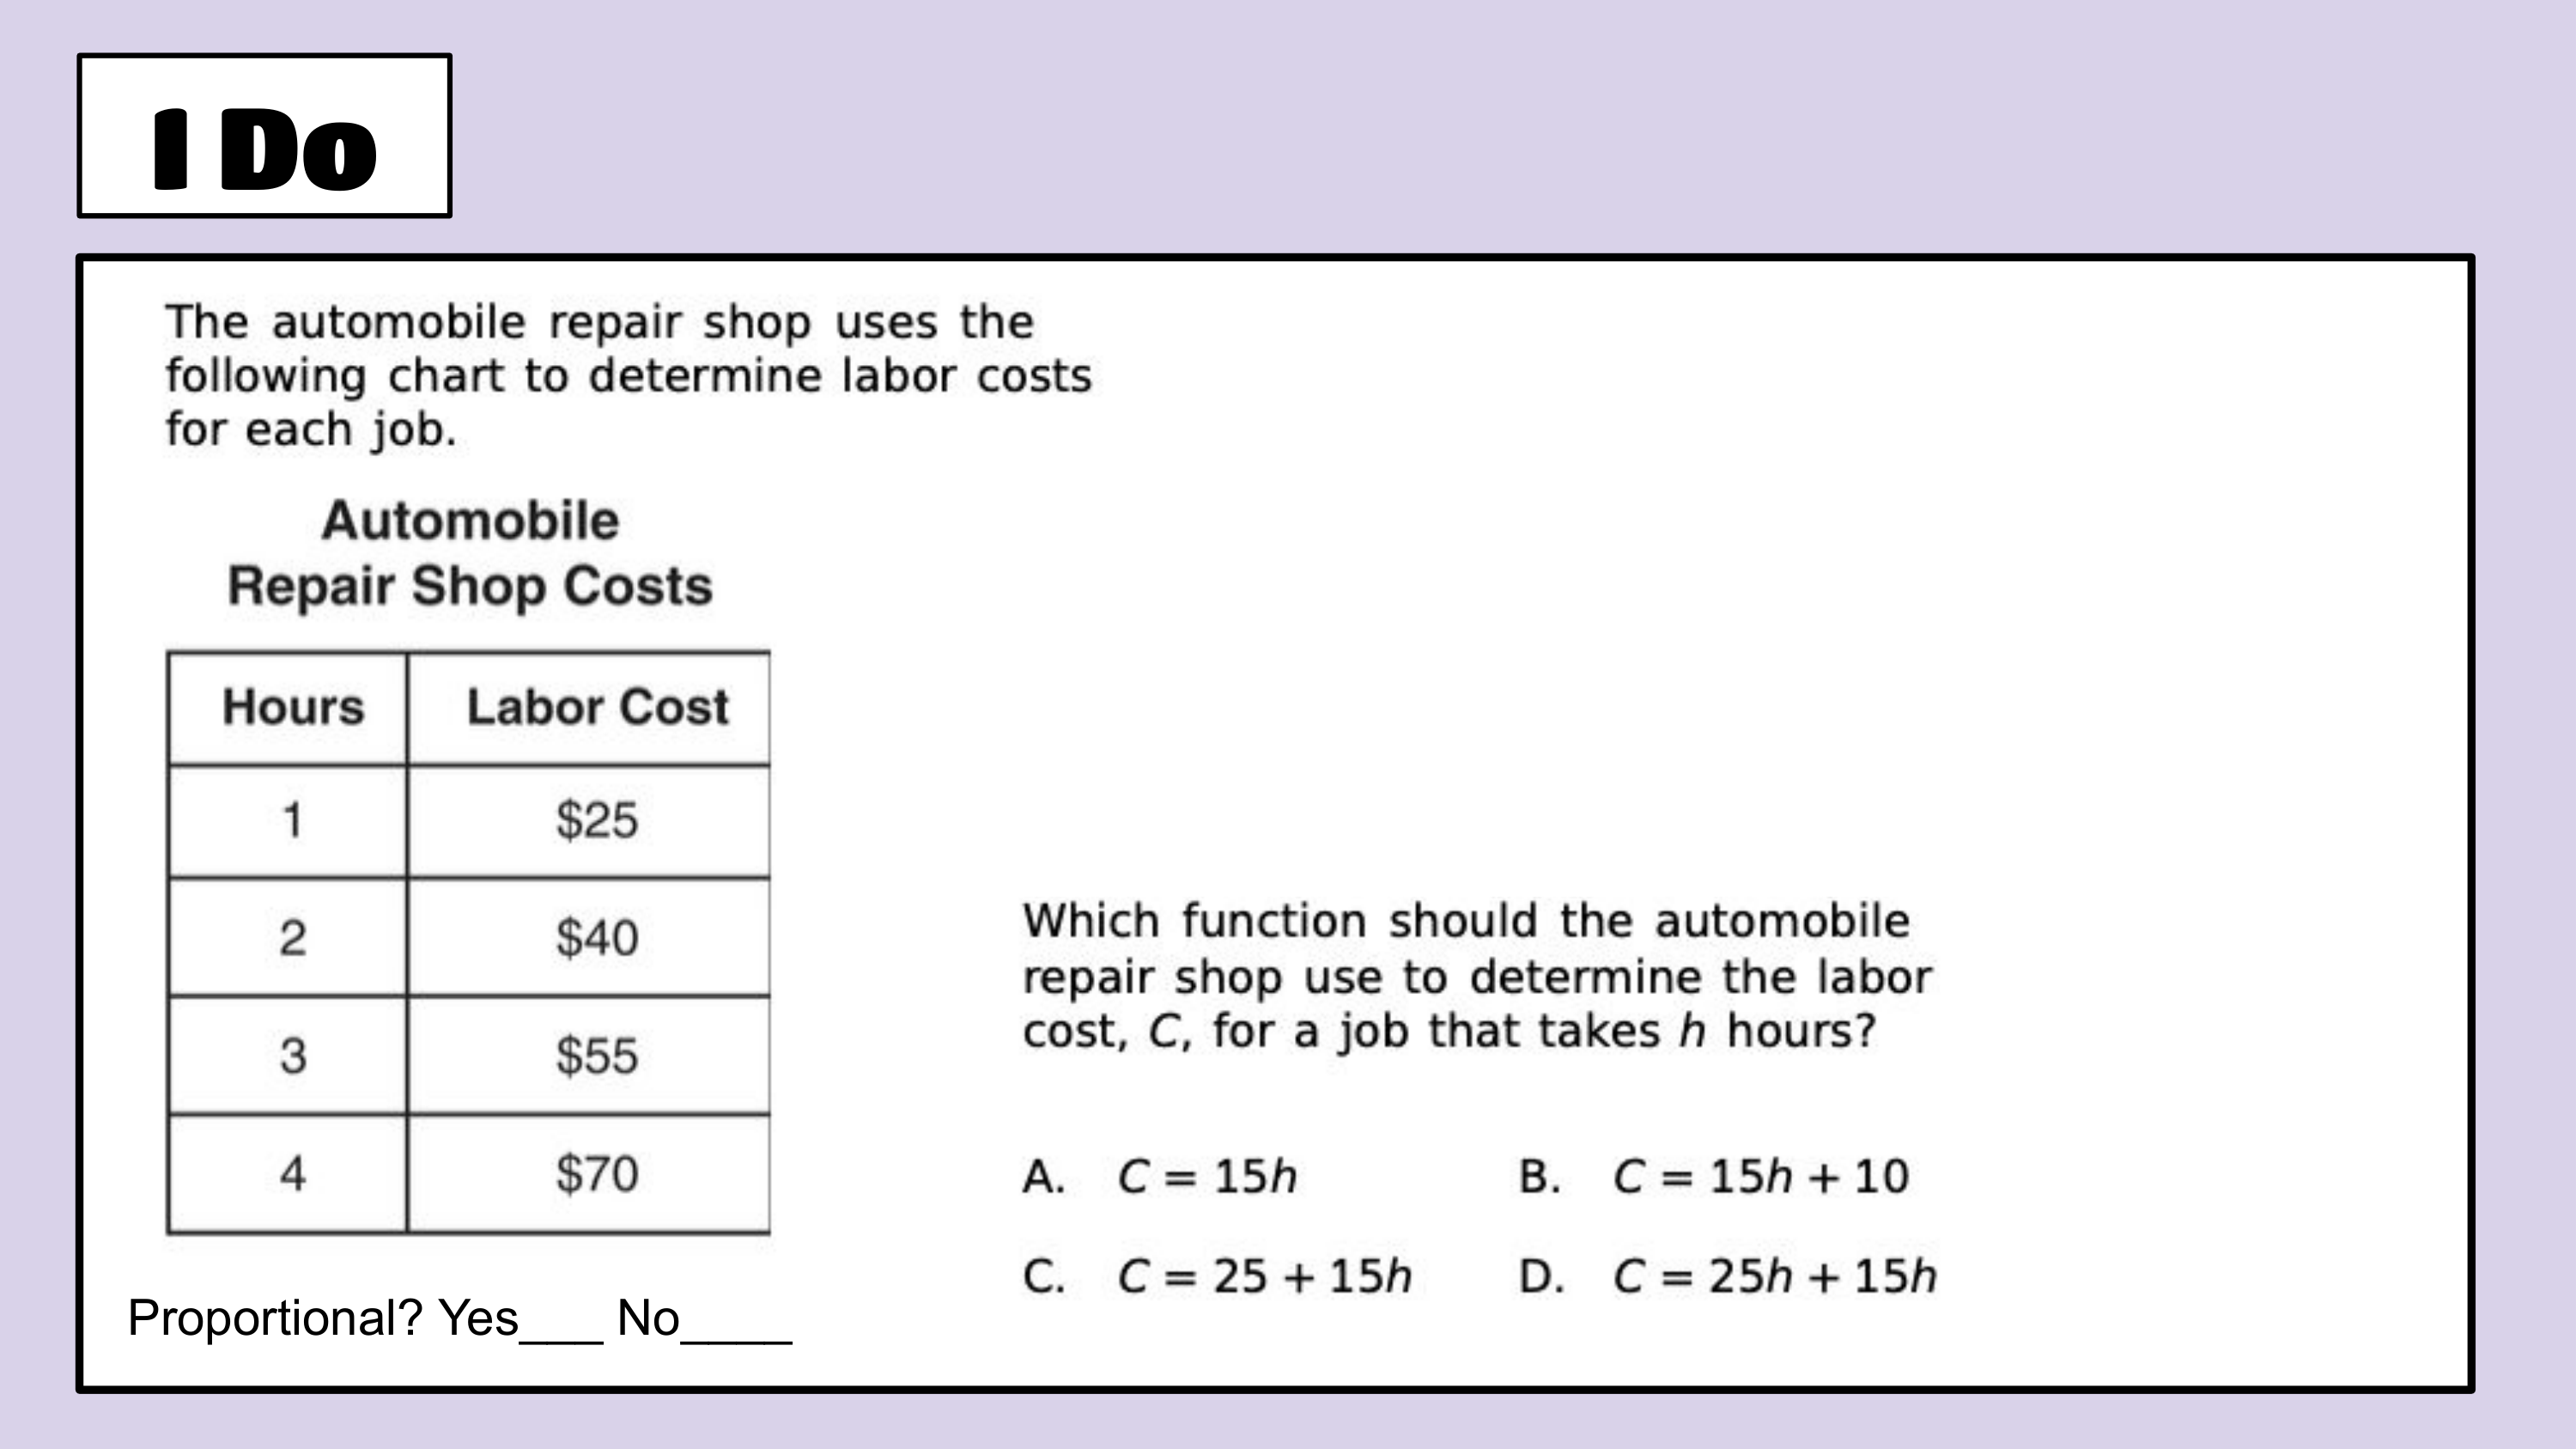
Which equation represents the relationship shown in the table?
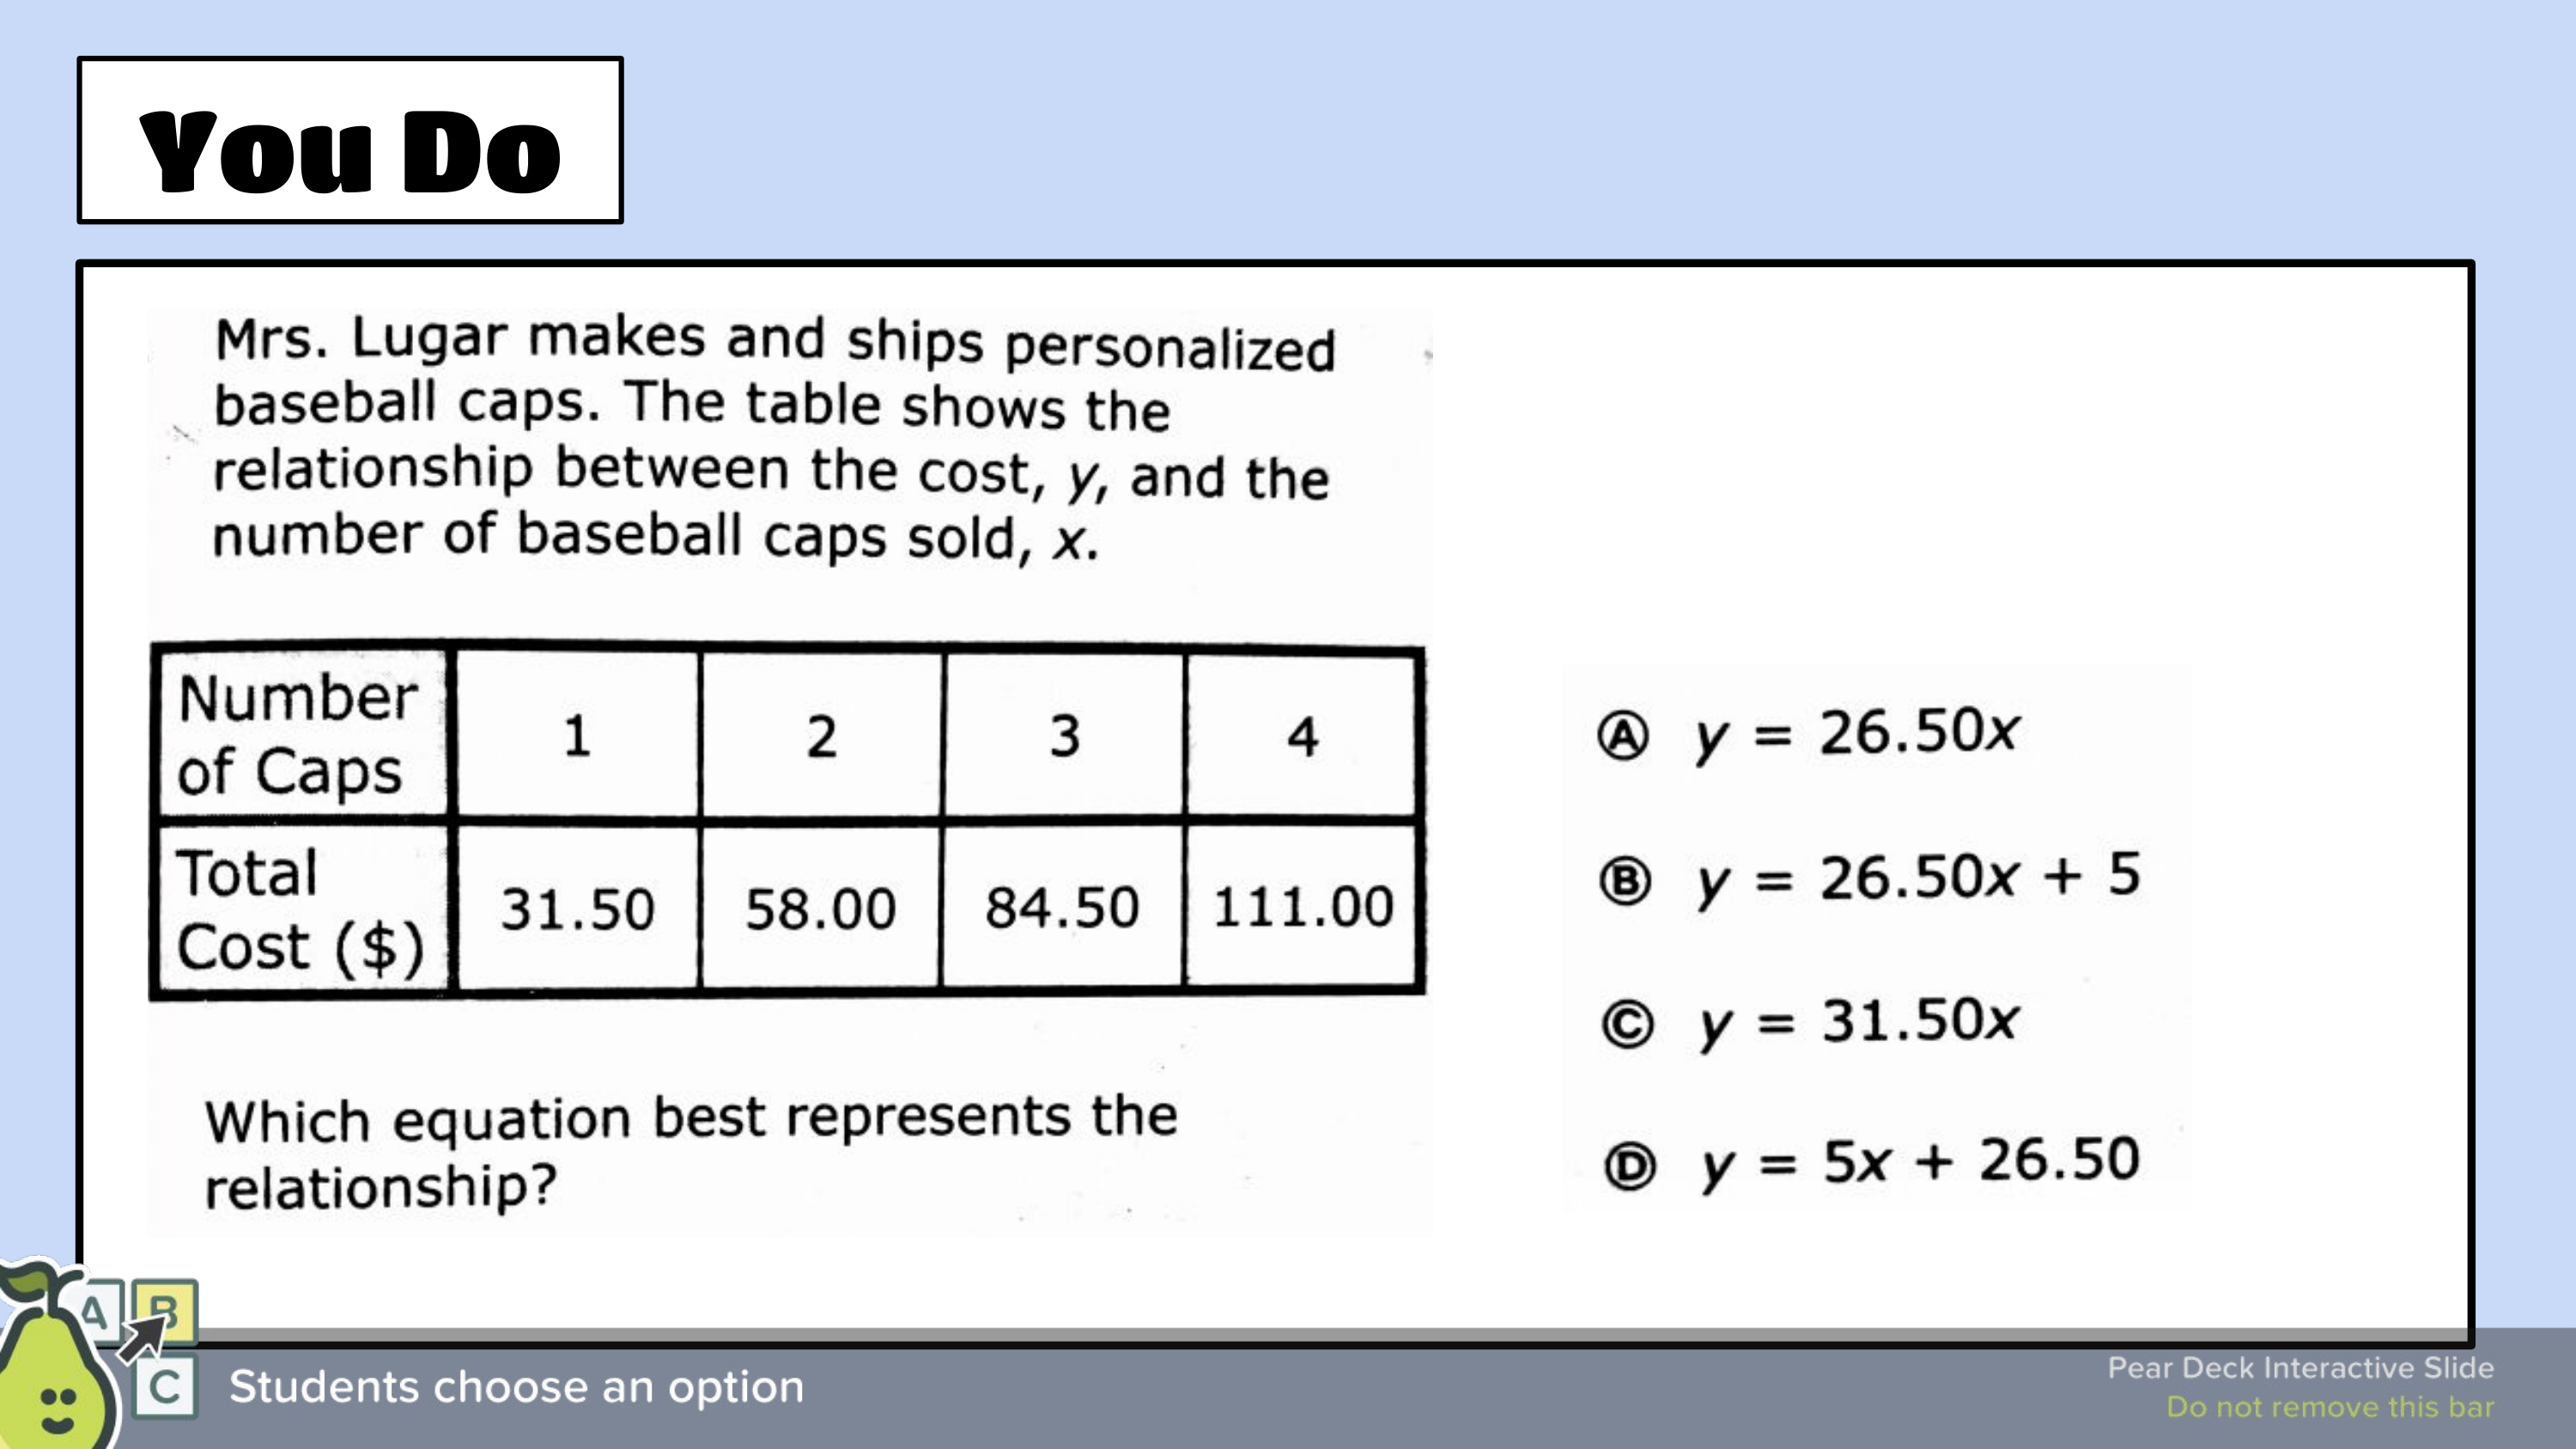
Which equation represents the relationship shown in the table?
Graded DOL:
Extra Credit (Due at the end of the week and you must login to complete it)
Link 1: https://www.ixl.com/math/grade-8/write-a-linear-equation-from-a-slope-and-y-intercept
Link 2: https://www.ixl.com/math/grade-8/write-a-linear-function-from-a-table
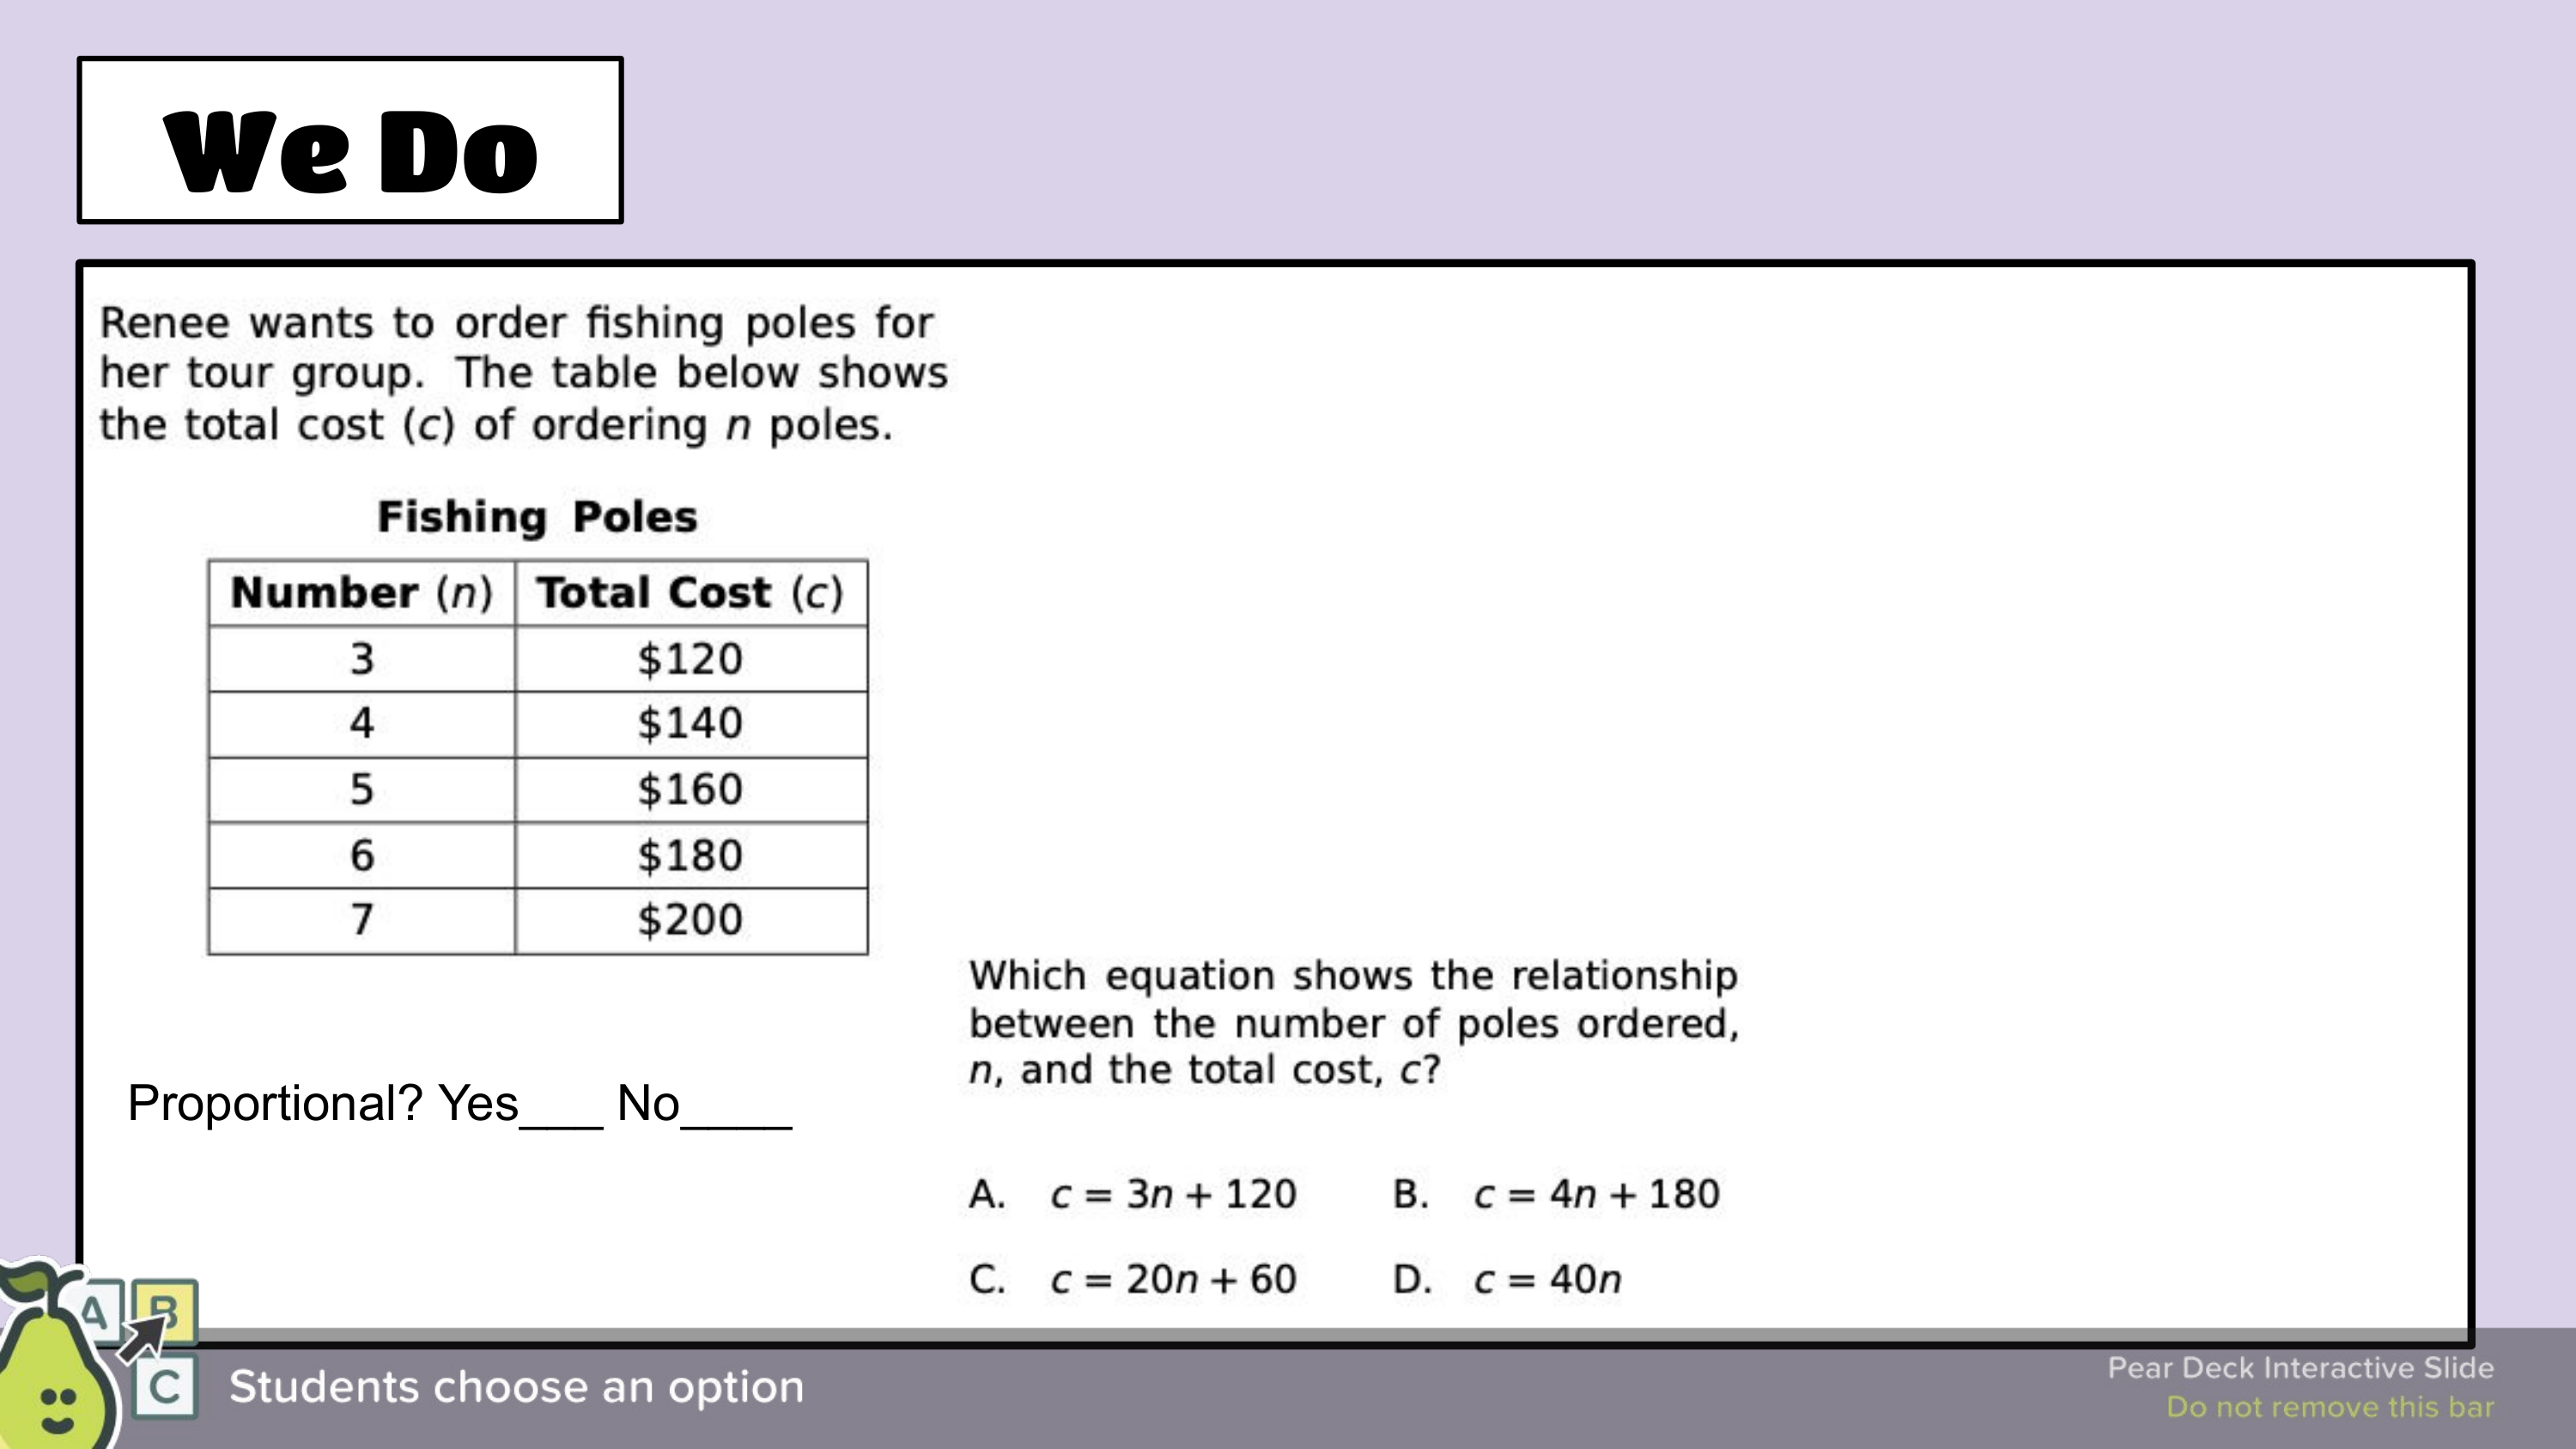
Which equation shows the relationship between the number of poles ordered, n, and the total cost, c?
Success Criteria:
1. I can indentify wehther the relationship is proportional or non-proportional.
2. I can calculate the slope in the given relationship.
3. I can calculate the y-intercept in the given relationship.
4. I can create a summary of the slope, y-intercept, or equation for the given relationship.
Which equation represents the relationship shown in the table?
Success Criteria:
1. I can indentify wehther the relationship is proportional or non-proportional.
2. I can calculate the slope in the given relationship.
3. I can calculate the y-intercept in the given relationship.
4. I can create a summary of the slope, y-intercept, or equation for the given relationship.
Which equation represents the relationship shown in the table?