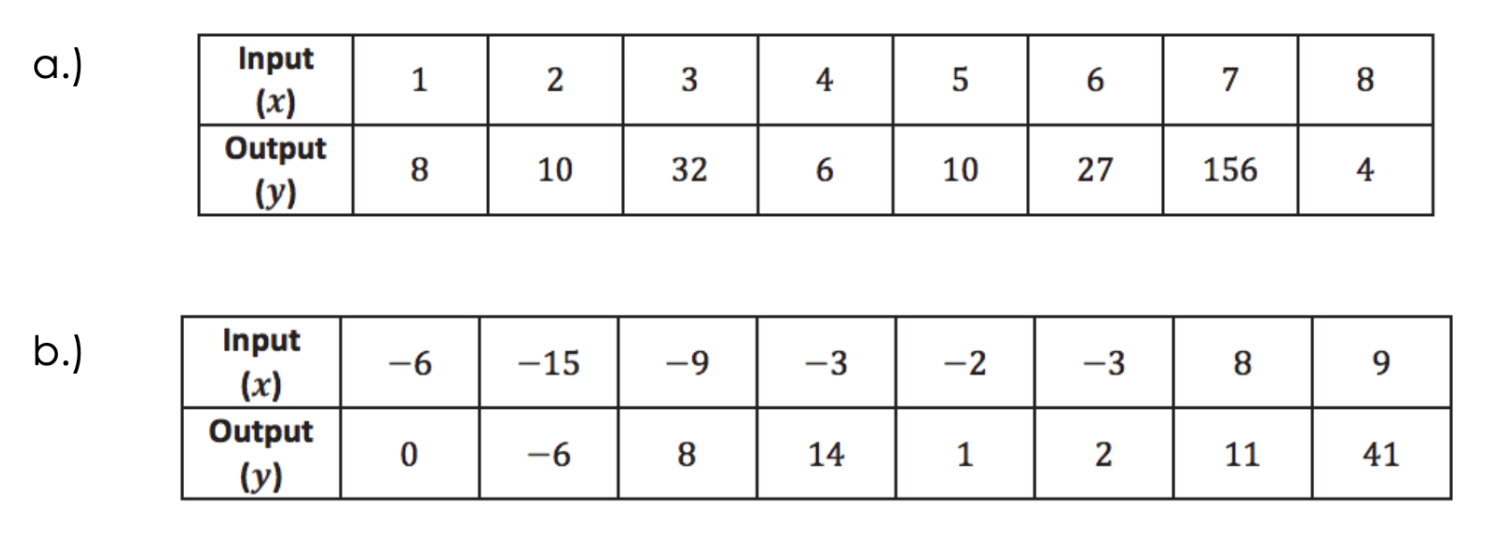
The table below represents the number of minutes Francisco spends at the gym each day for a week.

Does the data shown below represent values of a function?
Explain. Please be specific and use the definition of a function in your explanation!
THIS QUESTION IS MANUALLY GRADED!
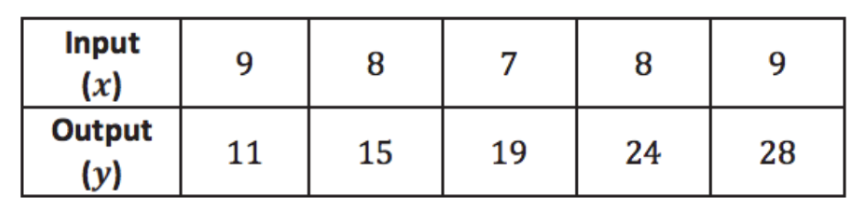
Can the table shown below represent values of a function?

Explain. Please be specific and use the definition of a function in your explanation!
THIS QUESTION IS MANUALLY GRADED!

Narmin examined the table of values shown below and stated that a possible equation to MATCH this function could be 𝑦 = −2𝑥 + 9.

Is Narmin correct?
Explain.
THIS QUESTION IS MANUALLY GRADED!

Meka said that the set of data in part (a) describes a function, but the set of data in part (b) does not.

Do you agree?
Explain why or why not.


CHALLENGE
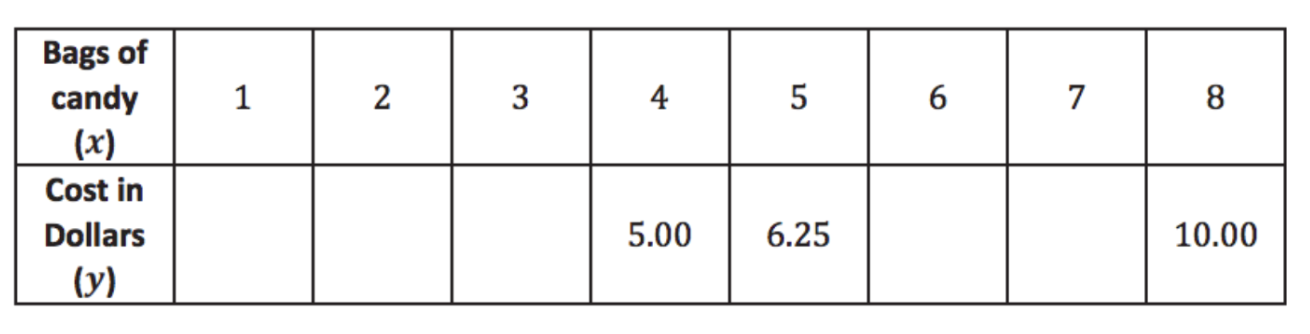
Examine the data in the table below. The inputs and outputs represent a situation where constant rate can be assumed. Determine the equation that describes the function.
HINT* - Can you find the slope and y-intercept and write the equation that represents the function in y=mx+b form?

Examine the data in the table below.
- inputs (x) represent the number of bags of candy purchased
- outputs (y) represent the cost.
Determine the cost of one bag of candy, assuming the price per bag is the same no matter how much candy is purchased. Then, complete the table.
How much is each bag of candy?
Can you determine the value of the output (y) for an input of 𝑥 = −4? If so, what is it?
Hint - Work backwards on the table!
Does an input of -4 make sense in this situation?
Yes or No?
Explain.