Economic Trends Activity
star
star
star
star
star
Posljednje ažuriranje over 5 years ago
13
1
1
1
1
1
1
1
1
1
1
1
1
1
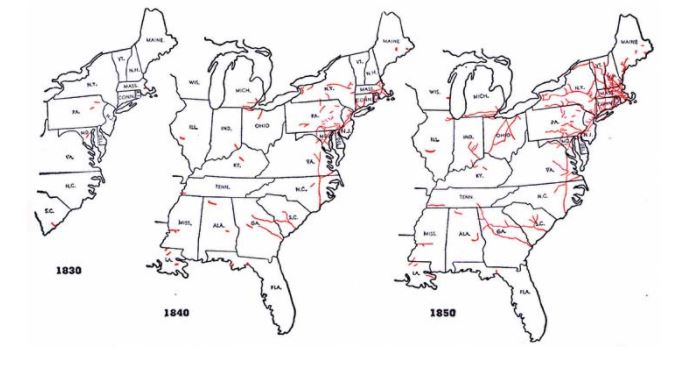
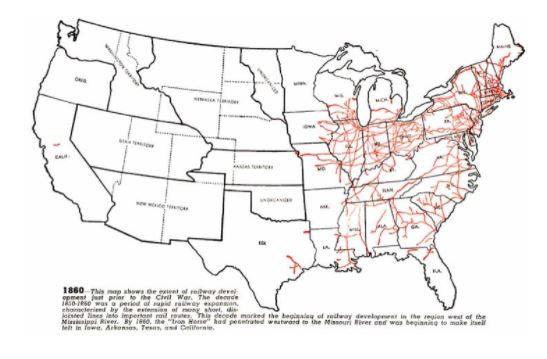
The maps above show railroads in red. What trends do you see across the four maps?
What might the land gains we've been talking about have to do with these trends?
What area(s) of the country have the most railroads by 1860? Why do you think that is?
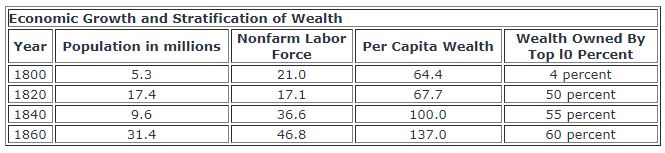
Based on the chart above, what happened to the "nonfarm labor force" (aka - the percent of people who work, but not on a farm) between 1800 and 1860?
What do you think might be causing that trend?
Based on the chart, what happened to "per capita wealth" (aka - the total wealth in the country divided by the number of people in the country) between 1800 and 1860?
Based on this chart, was the average American getting wealthier? How do you know?
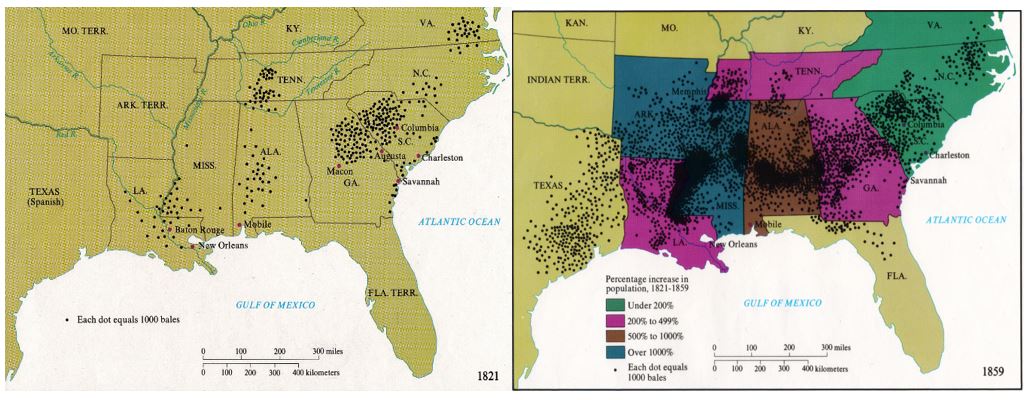
What do the black dots on the maps represent?
How does cotton prodcution change between 1821 and 1860?
What pattern can you see in where cotton is being produced? What might explain this pattern?
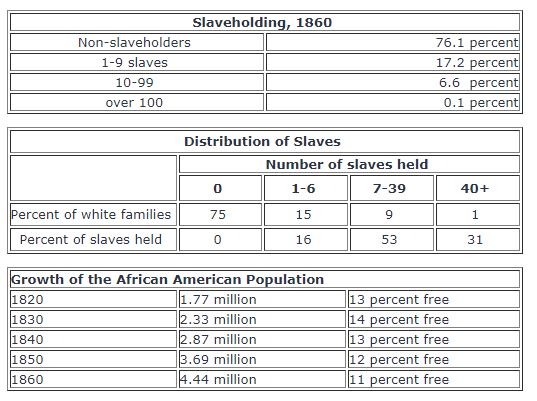
The first two charts show what percent of the Southern population owned certain amounts of slaves. What trend do you notice in this data?
Using the data in the third chart, about how many slaves were being held in bondage in the US in 1820? In 1860?
How do you think westward expansion impacted cotton production and slavery? Explain your answer.