1
What is the minimum?
What is the minimum?
1
1
1
1
1
1
Draw a box and whisker plot based on the five-number summary given.
Draw a box and whisker plot based on the five-number summary given.
What is the minimum?
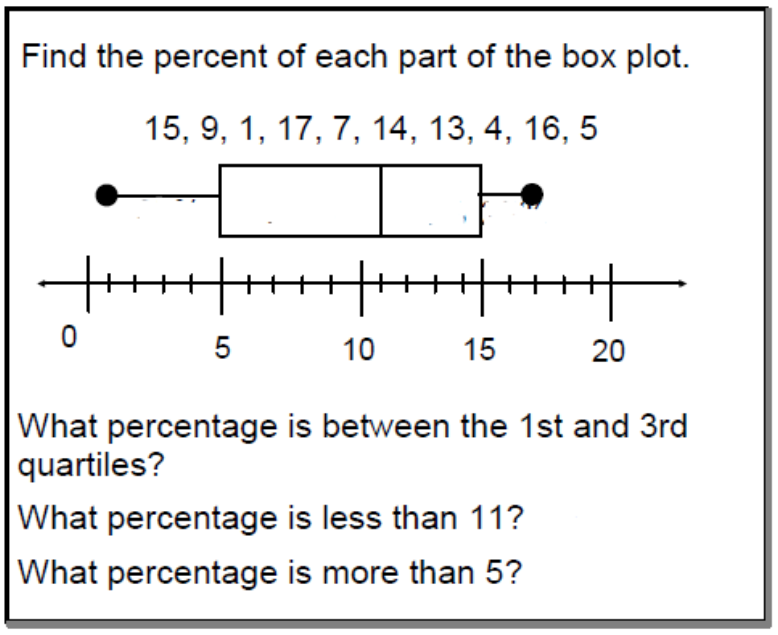
Use the data set given to fill in the five-number summary and IQR, then draw the box and whisker plot.
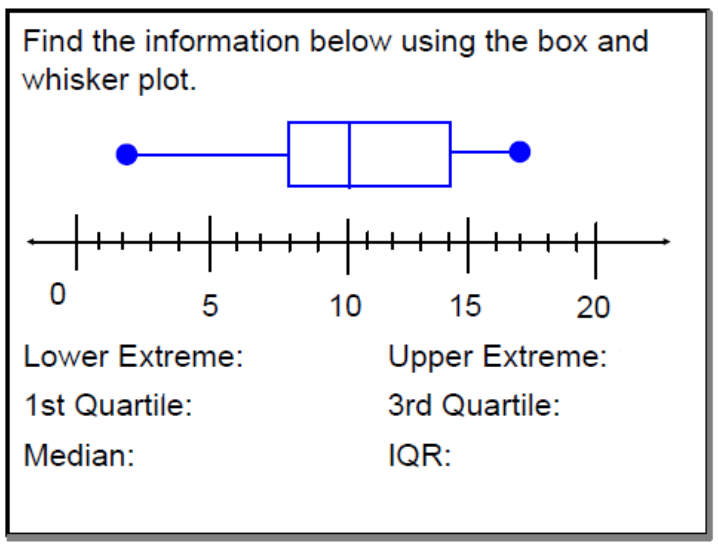
What is the maximum?
What is the first quartile?
What is the third quartile?
What is the median?
What is the interquartile range?
What is the range?