Algebra I.2.D.14 -Modeling Relationships with a Line - Exit Ticket
star
star
star
star
star
Last updated over 5 years ago
4 Nsɛmmisa
10
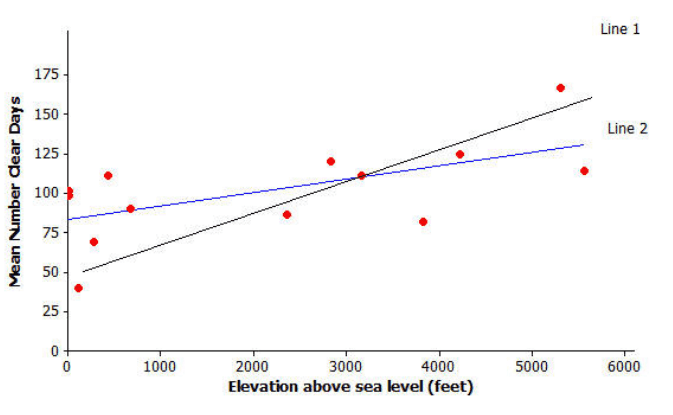
The scatter plot above displays the elevation and mean number of clear days per
year of 14 U.S. cities. Two lines are shown on the scatter plot. Which
represents the least squares line? Explain your choice.
The scatter plot above displays the elevation and mean number of clear days per year of 14 U.S. cities. Two lines are shown on the scatter plot. Which represents the least squares line? Explain your choice.

10
10
How would you interpret the value of the slope in the least squares line?
How would you interpret the value of the slope in the least squares line?
10