Analyzing Graphs
star
star
star
star
star
Posljednje ažuriranje about 5 years ago
10
1
1
1
1
1
1
1
1
1
1
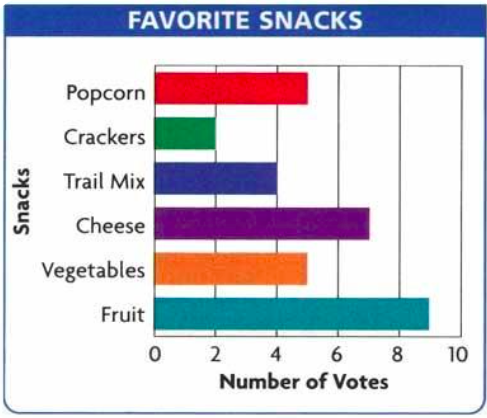
How many people liked cheese for their snacks?
How many people chose trail mix as their favorite snack?
How many more people voted for fruit than vegetables?
How many people in all voted for their favorite snack?

Be careful - look at the key! How many girls are in the 9th class?
Be careful - look at the key! How many girls are in the 6th class?
Be careful - look at the key! How many fewer girls are in the 7th class than the 5th class?
Ice Cream Shop Sales

What day did they sell the most ice cream cones?
Ice Cream Shop Sales
How many ice cream cones did they sell on Thursday? Don't forget to look at the key!
Ice Cream Shop Sales
How many ice cream cones did they sell on Wednesday AND Thursday?
