A
B
C
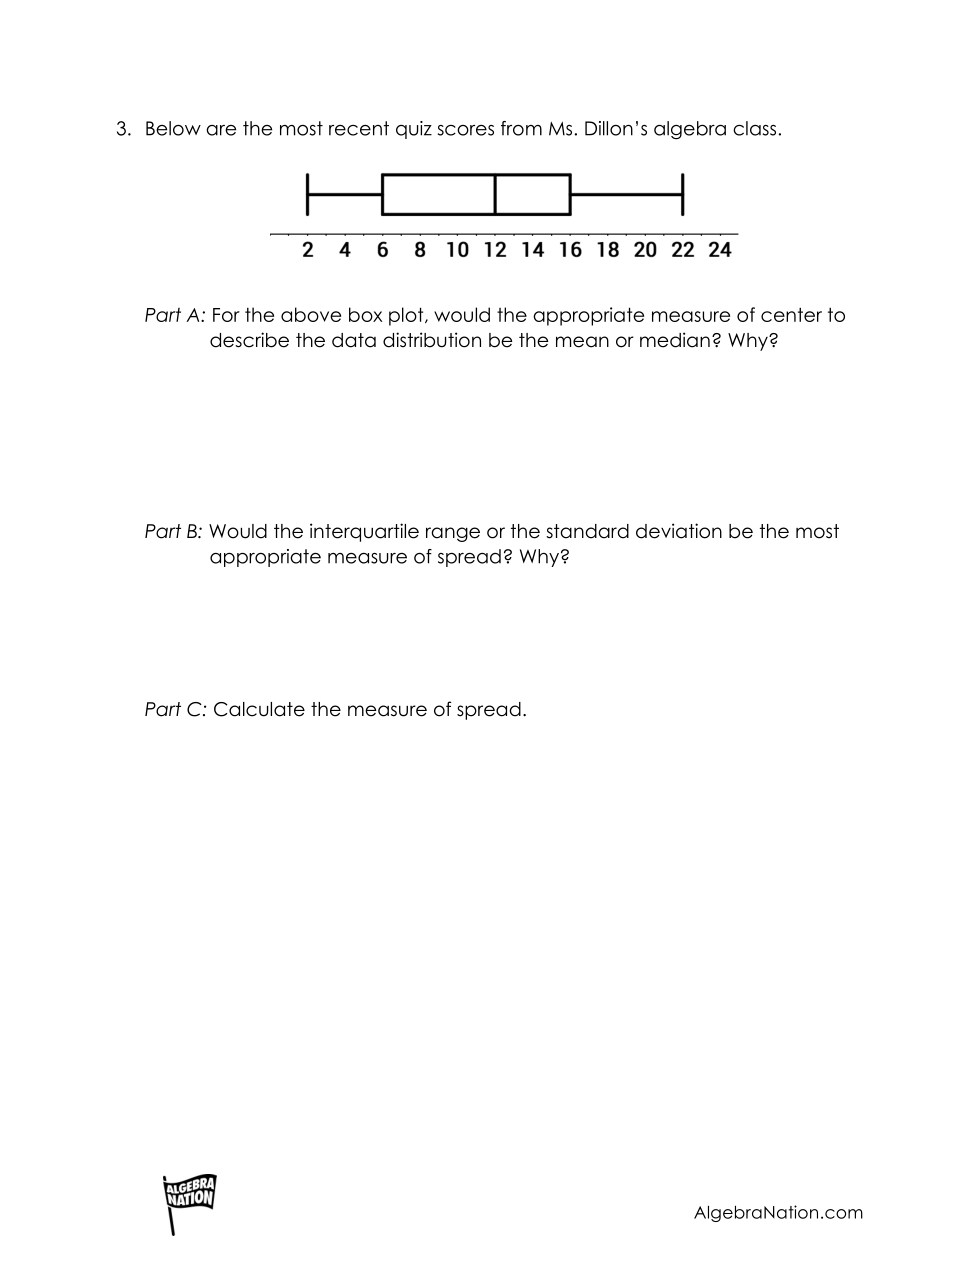
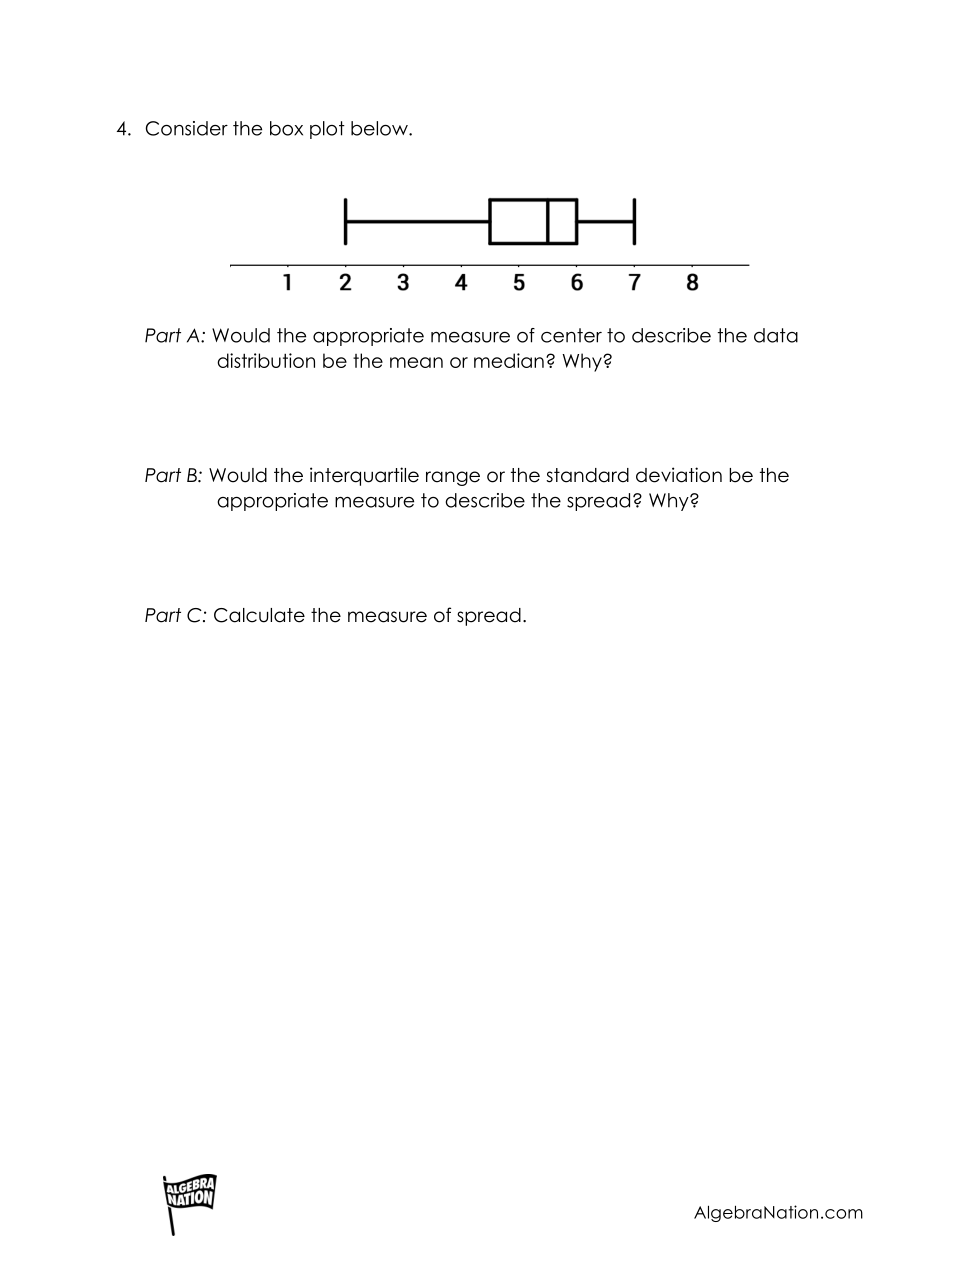
What information do you get from a box plot?
Where does the information come from?
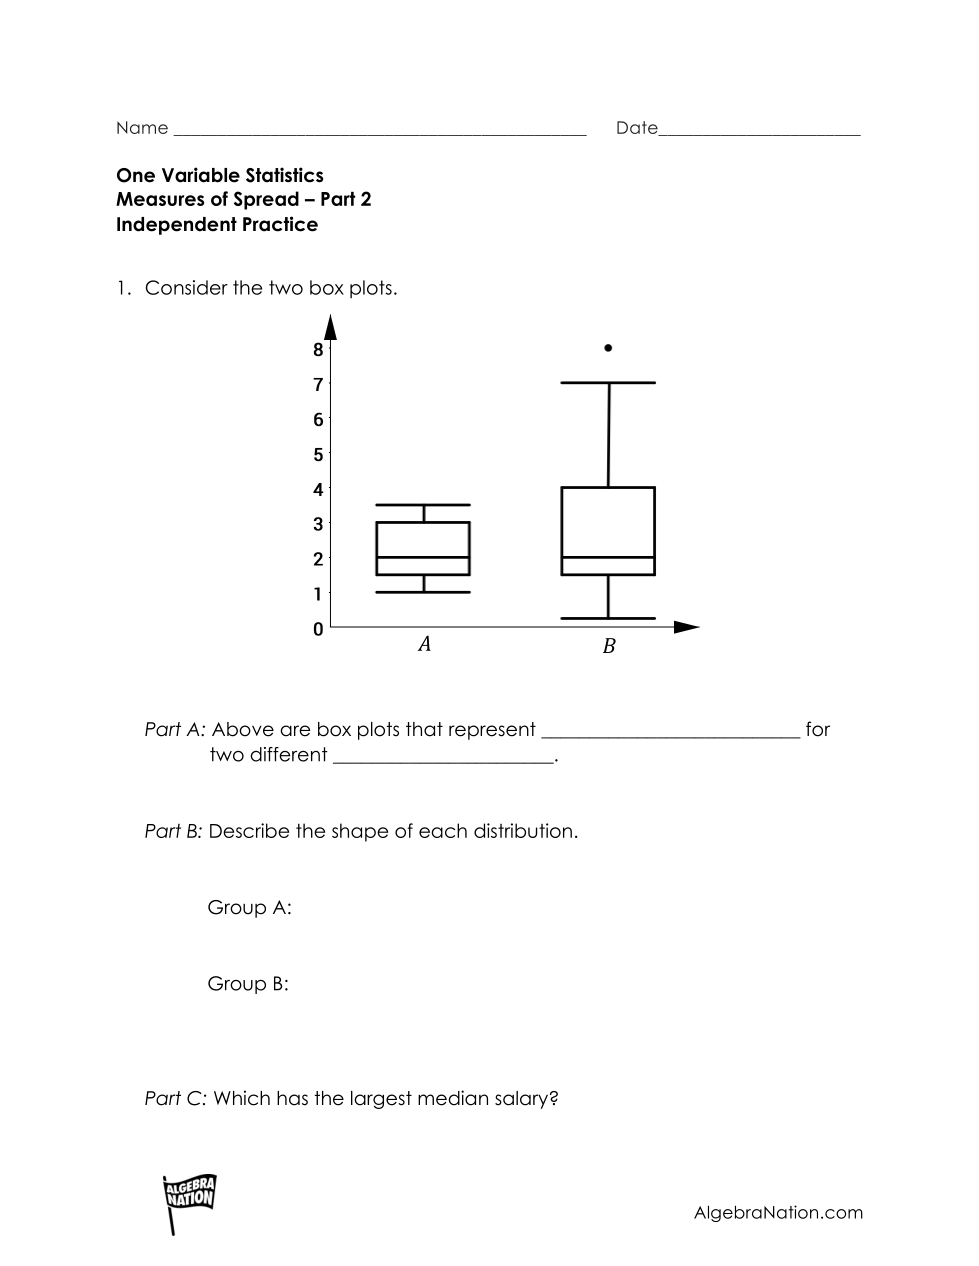
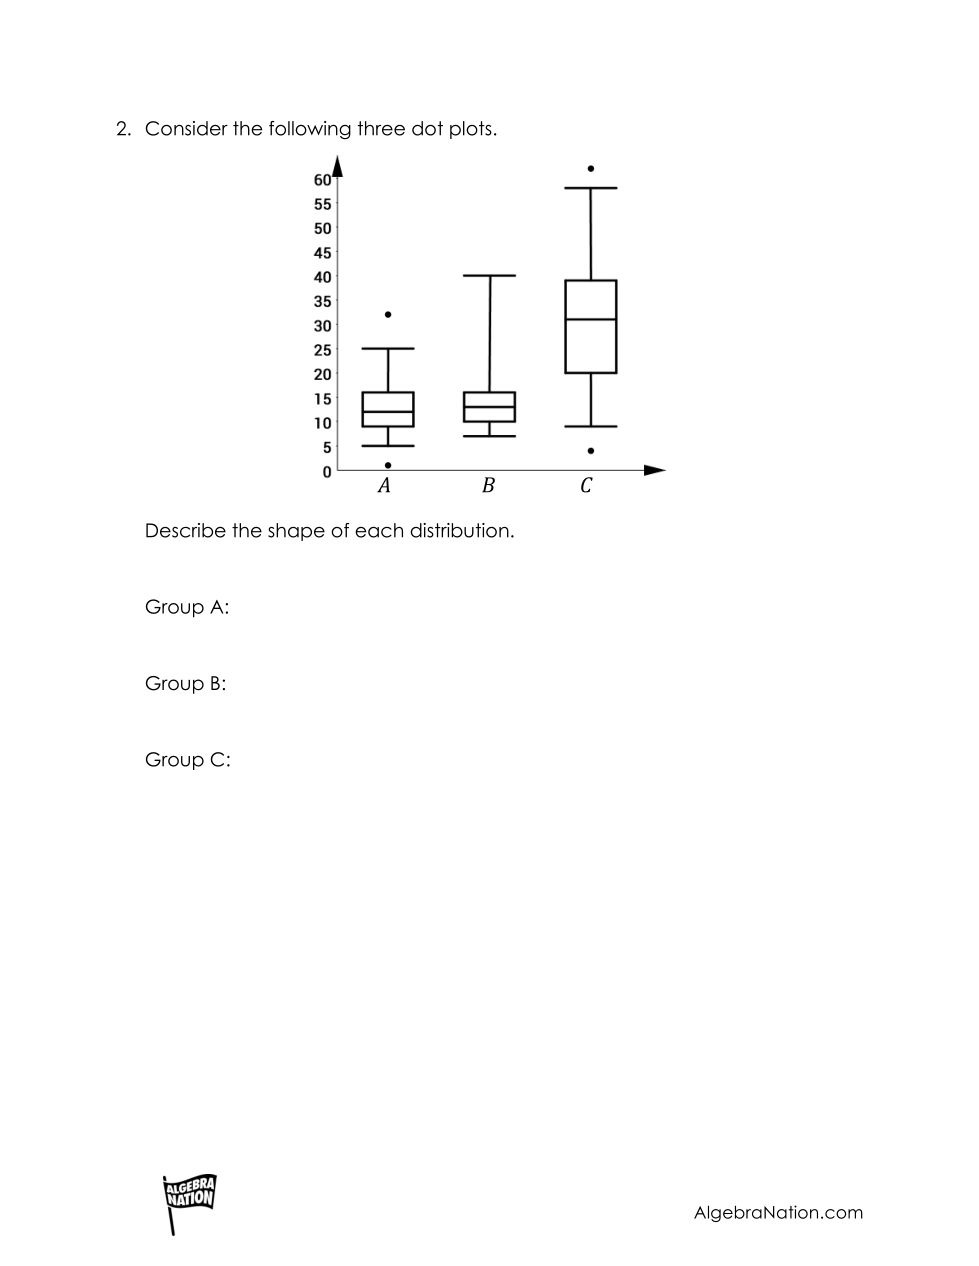
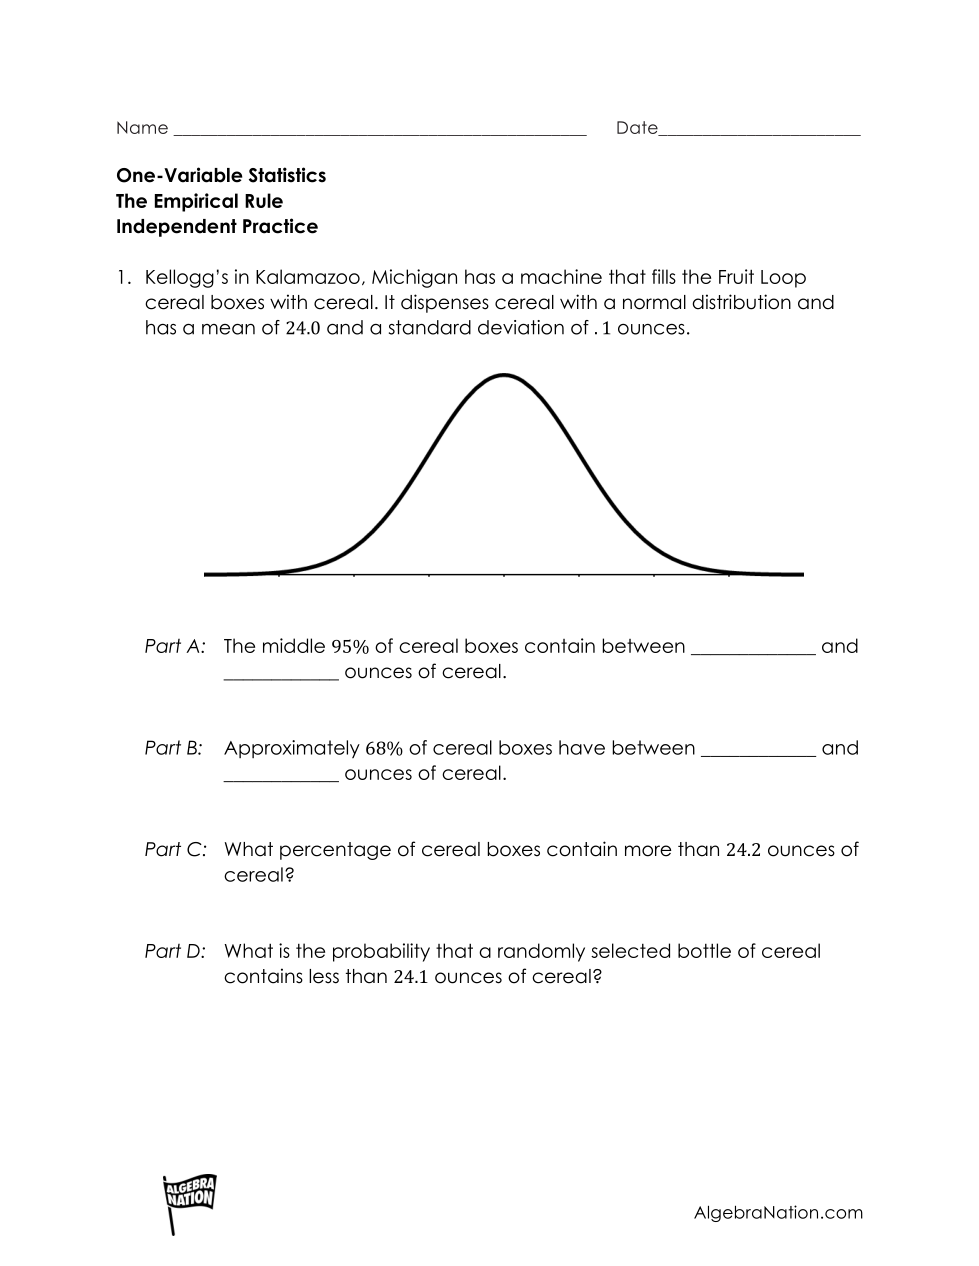
normal
skewed right
skewed left
What percent?
What percentile?
same
mean
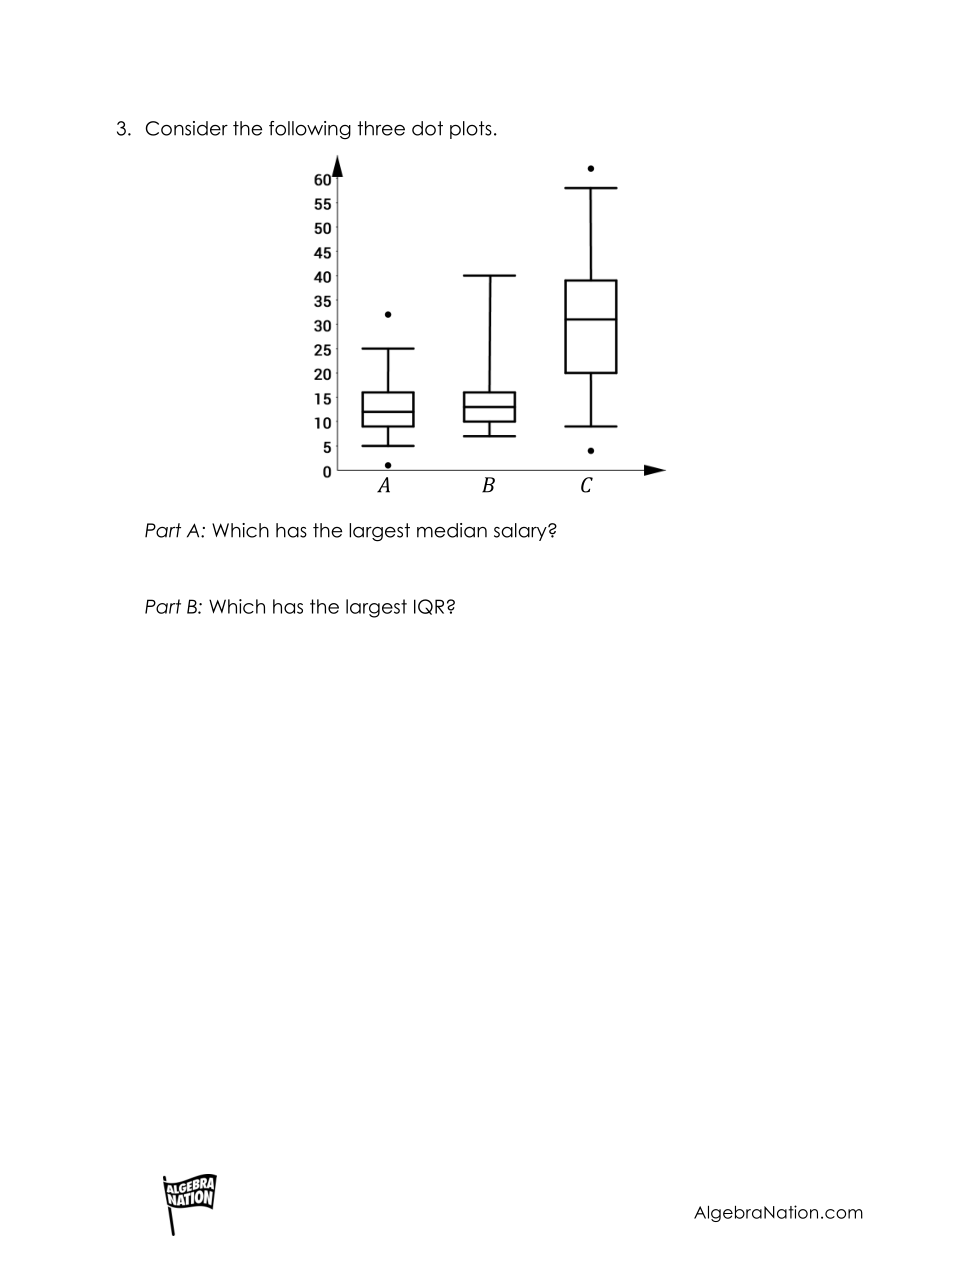
median
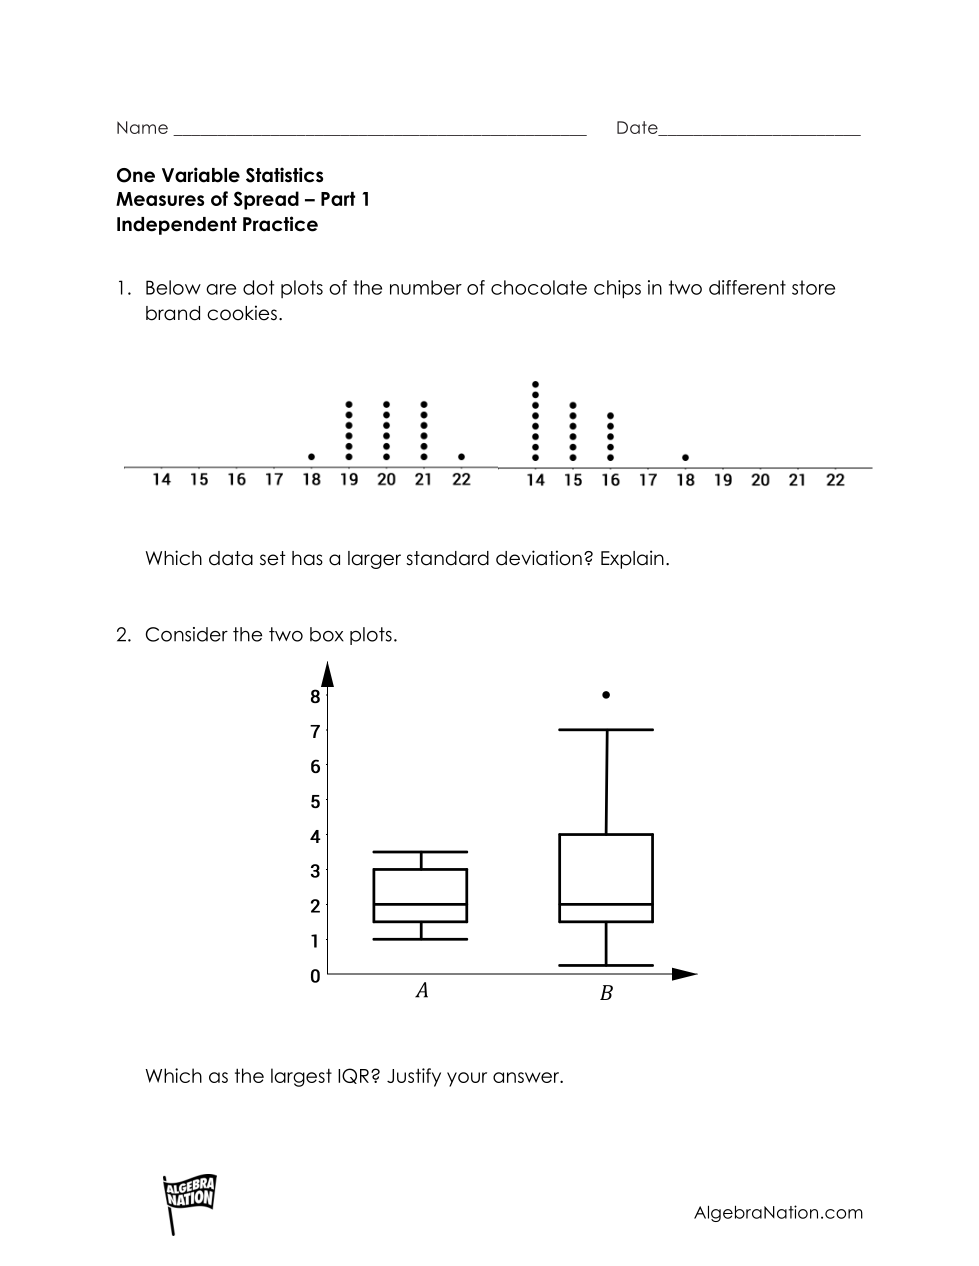
IQR
standard deviation