U11 Bivariate Data Practice
star
star
star
star
star
Posljednje ažuriranje about 5 years ago
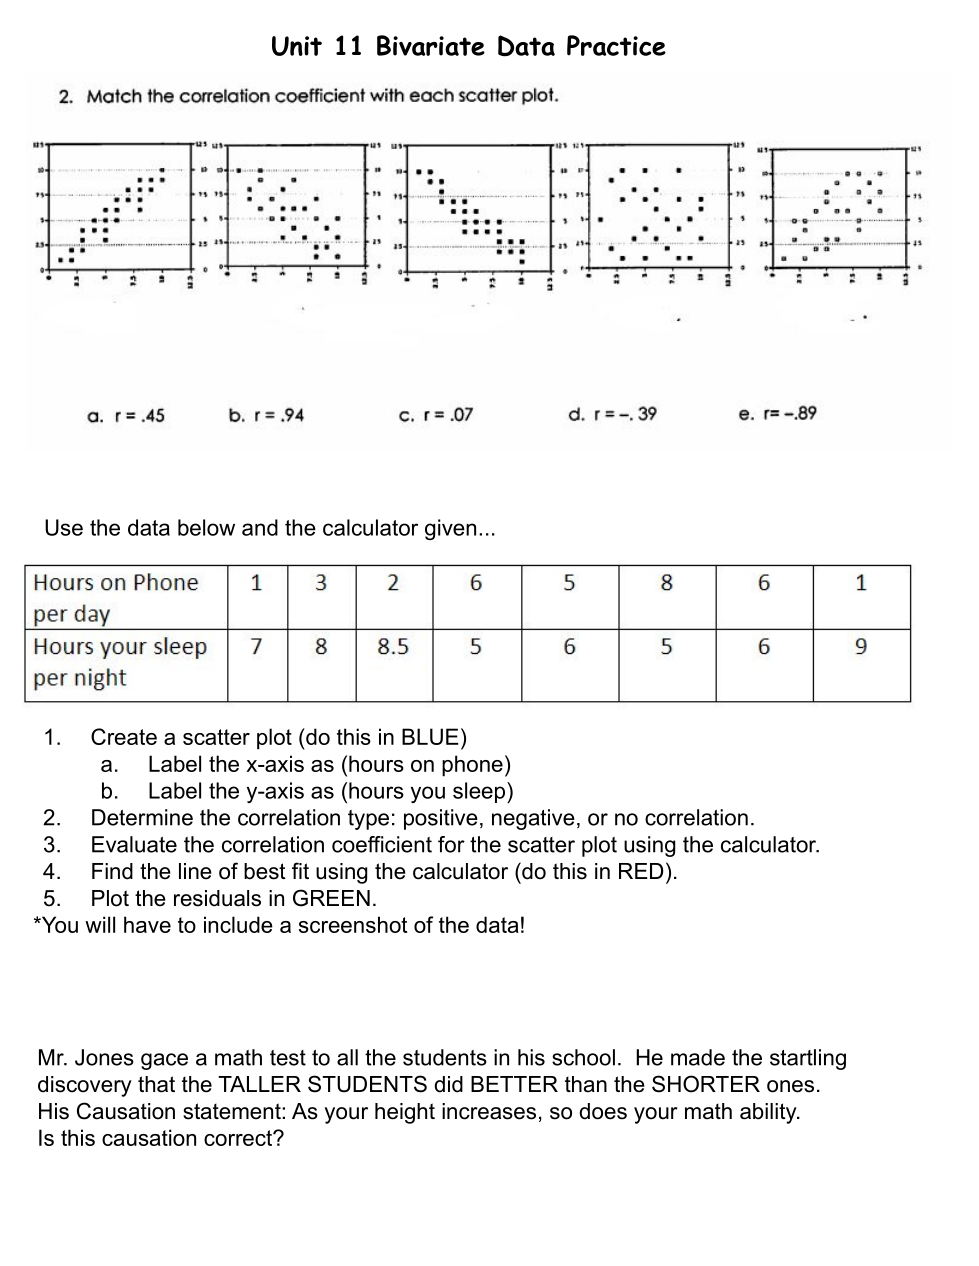
12
9
7
1
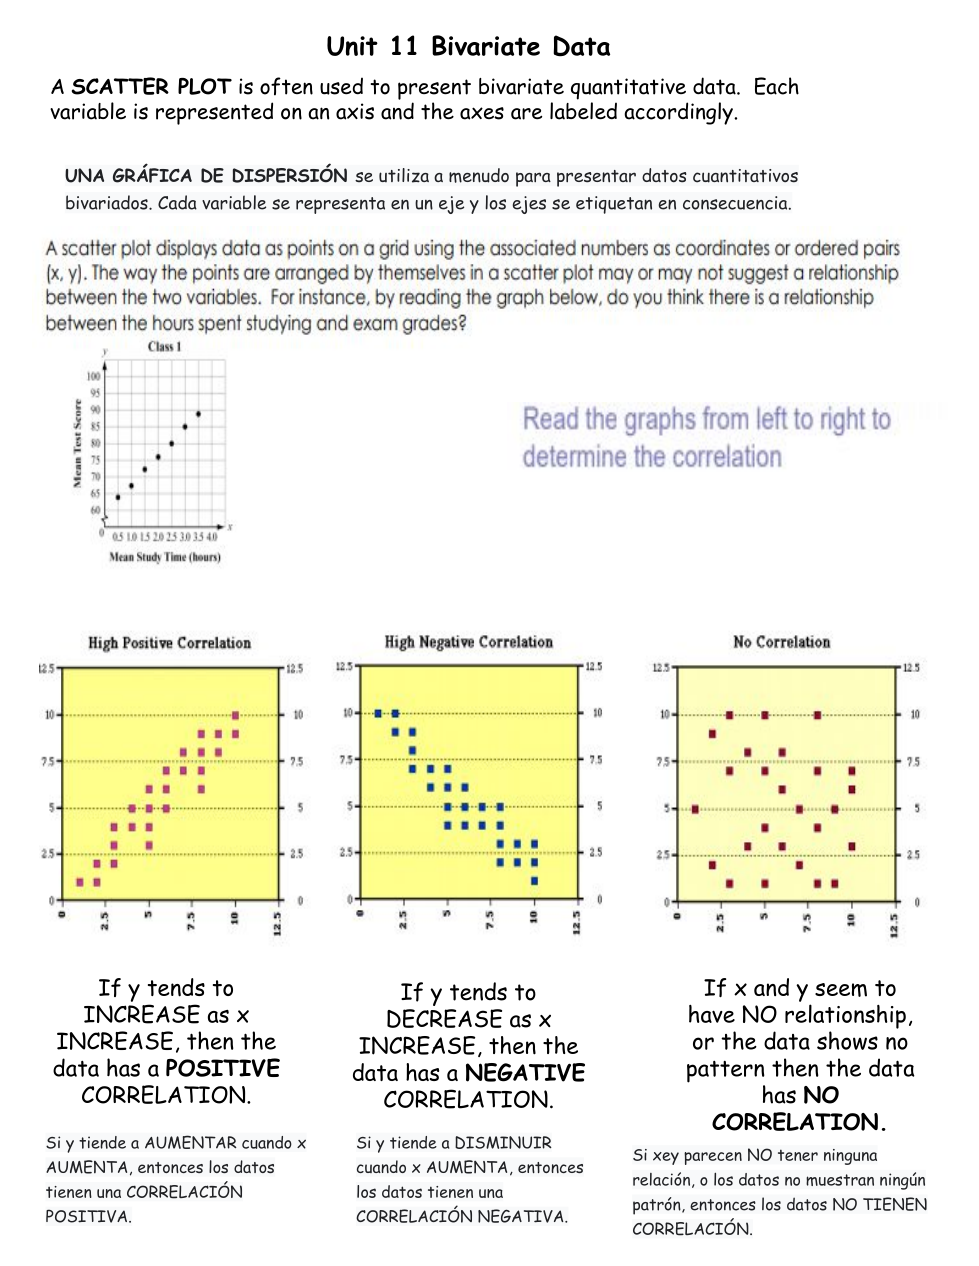
Do you think there is a relationship between the hours spent studying and exam grades? (refer to the graph)
Do you think there is a relationship between the hours spent studying and exam grades? (refer to the graph)