Based on this drawing, which direction would you predict the wind is blowing?
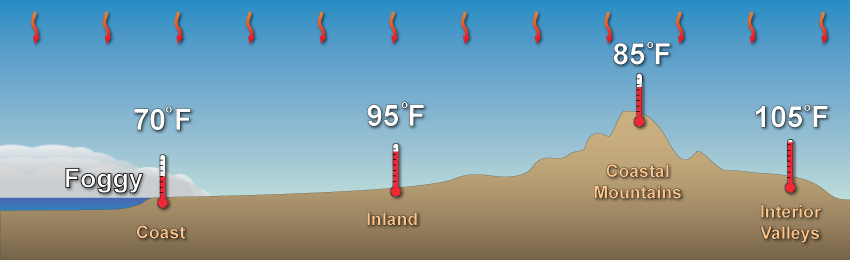
Based on this drawing, which direction would you predict the wind is blowing?
Which is an example of climate, and which is an example of weather?
| Draggable item | arrow_right_alt | Corresponding Item |
|---|---|---|
Climate | arrow_right_alt | Hurricane Laura hit Lousiana in August 2020 with winds of 150 mph. |
Weather | arrow_right_alt | On average, Beaverton gets 36 inches of rain each year while Bend, Oregon gets only 12 on average. |
In Oregon & Washington, the region with the greatest rainfall is the coastal mountains. Thinking about the water cycle, why is that? Choose one:
Based on this drawing, which direction would you predict the wind is blowing?
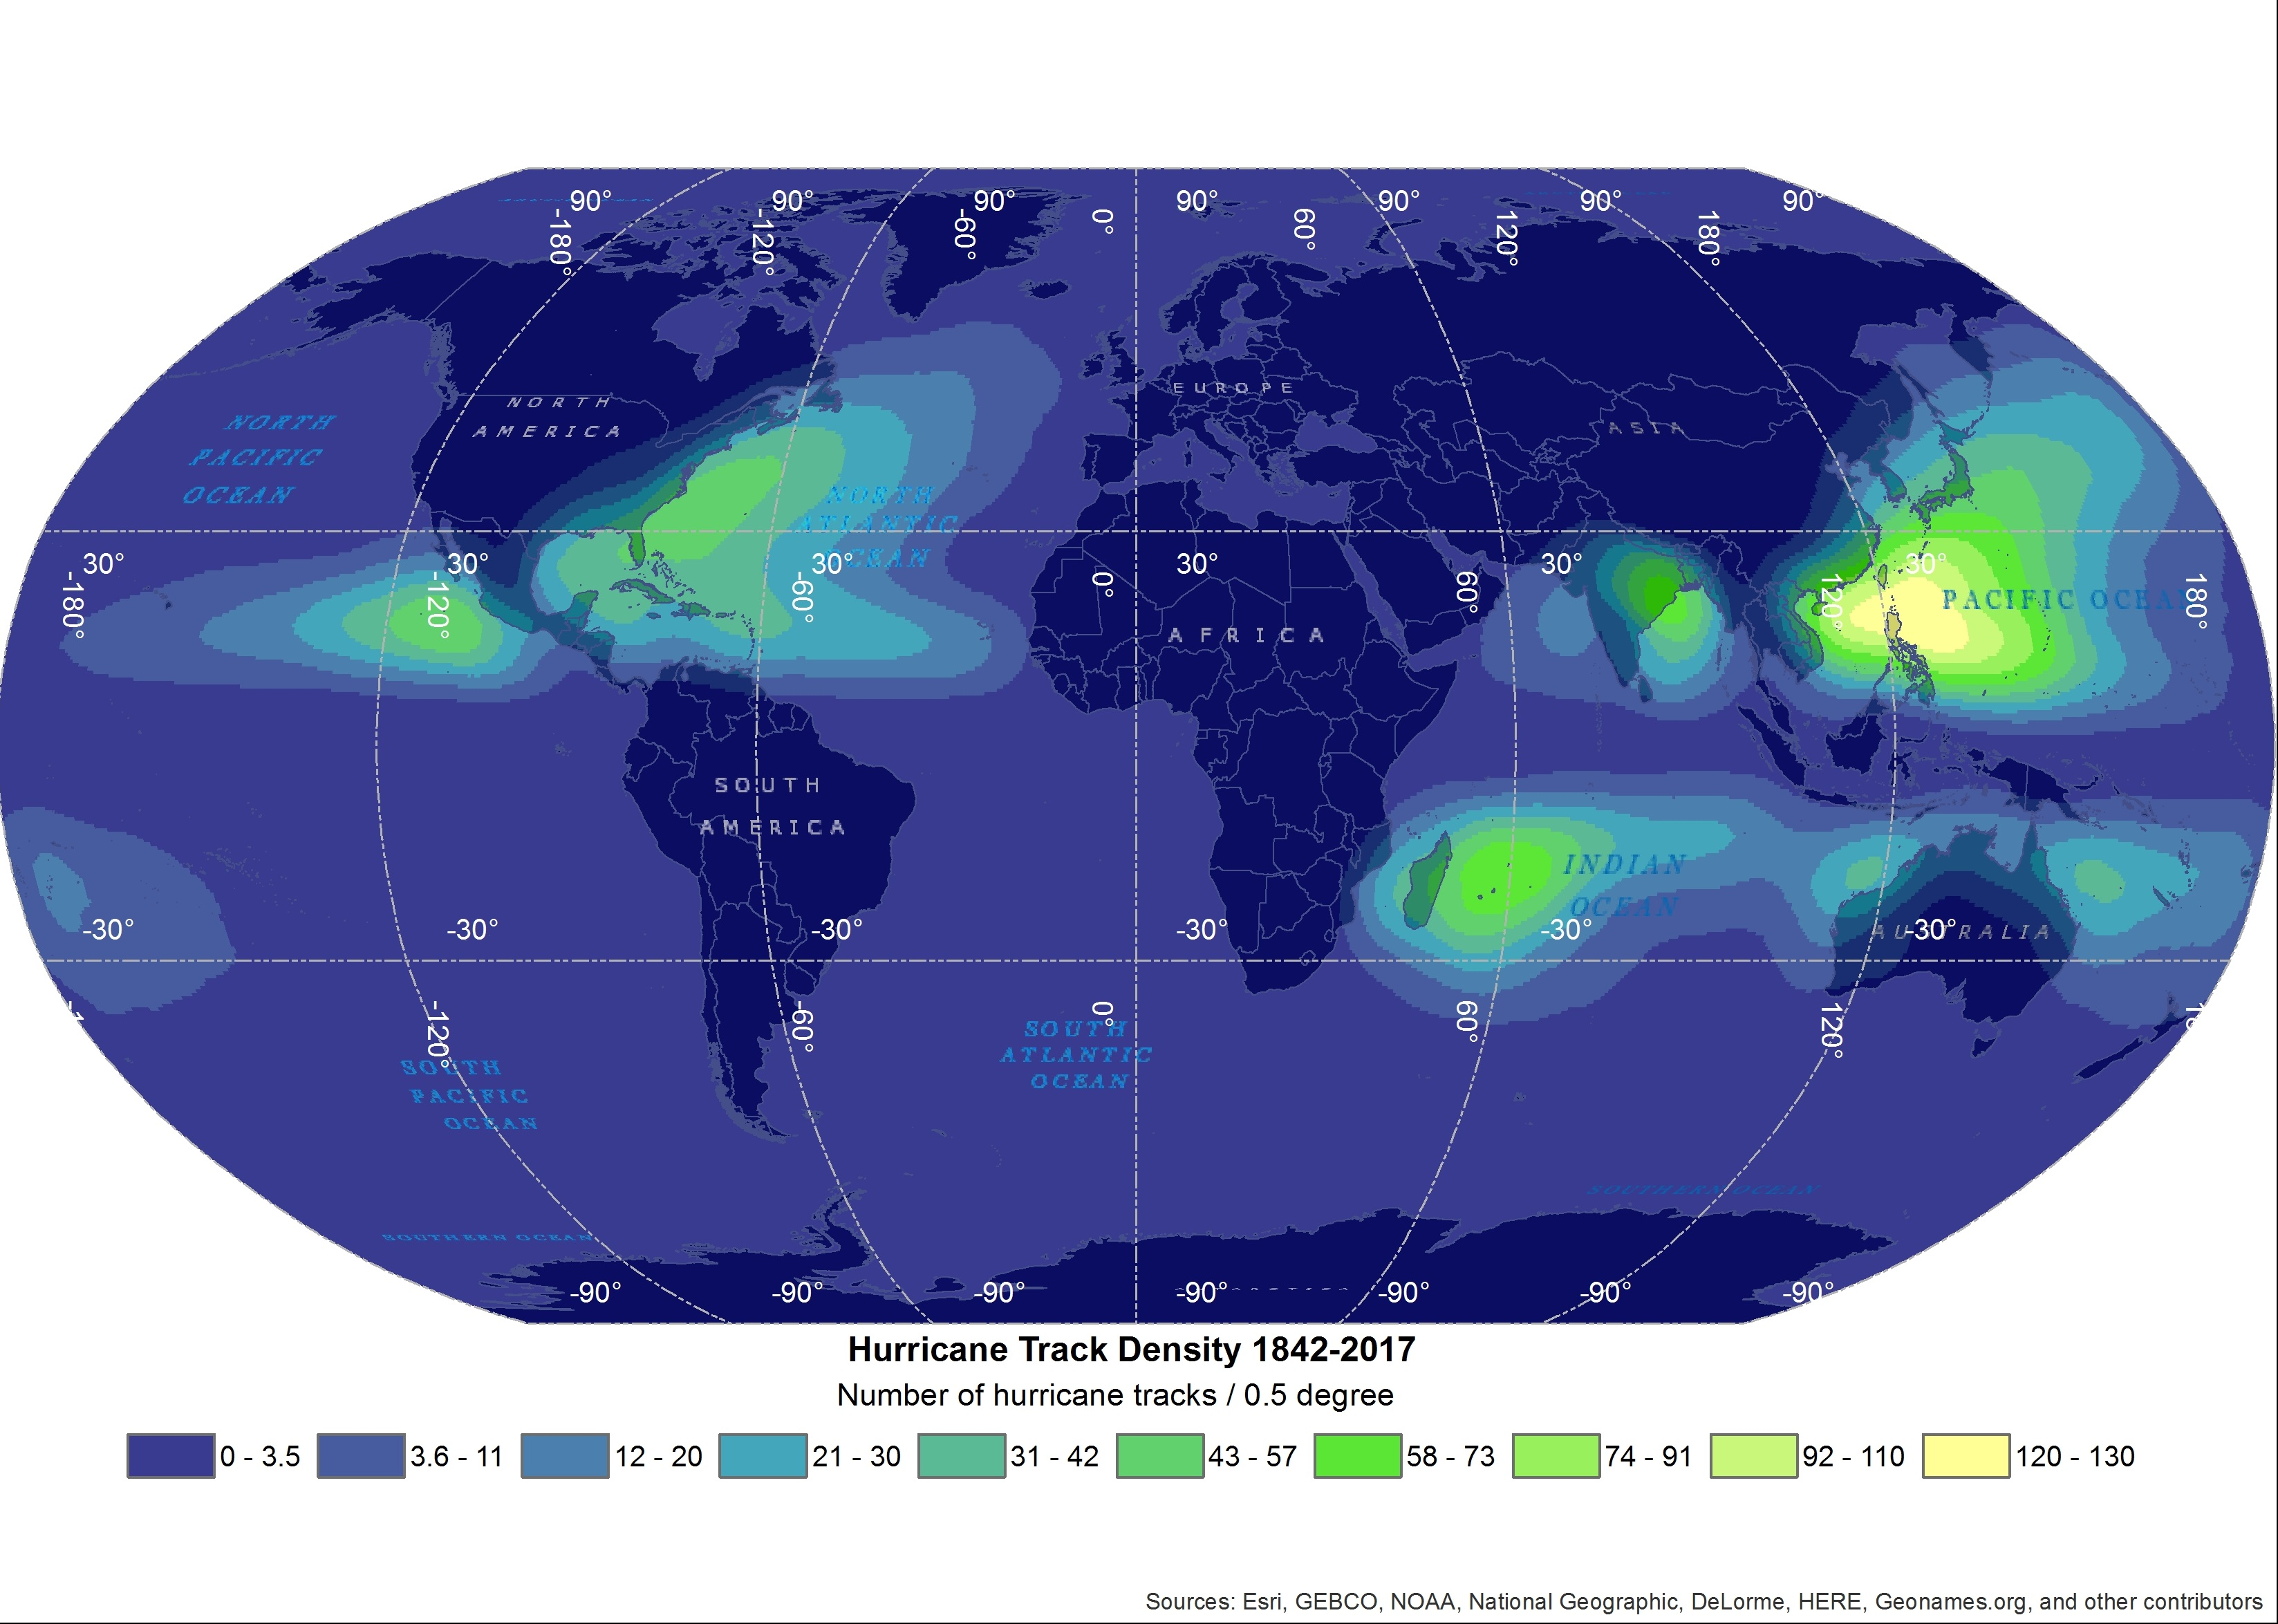
The strongest wind speed ever recorded was Cyclone Olivia in Australia at 253 mph! In a hurricane, the winds are all blowing towards a central point called an "eye" and spiraling around it. Based on this, the eye is probably:
Choose two things that are true about the Coriolis effect:
Florida has been hit by a hurricane 117 times in recorded history. Oregon? Zero times. Which of these best explains why?
2020 was a record-setting year for Atlantic storms, with 29 storms, 18 hurricanes and about $26 billion in damages. Yikes! Scientific evidence shows that over time, hurricanes have been increasing in intensity and destruction. This question challenges you to think about why hurricanes might be getting worse.
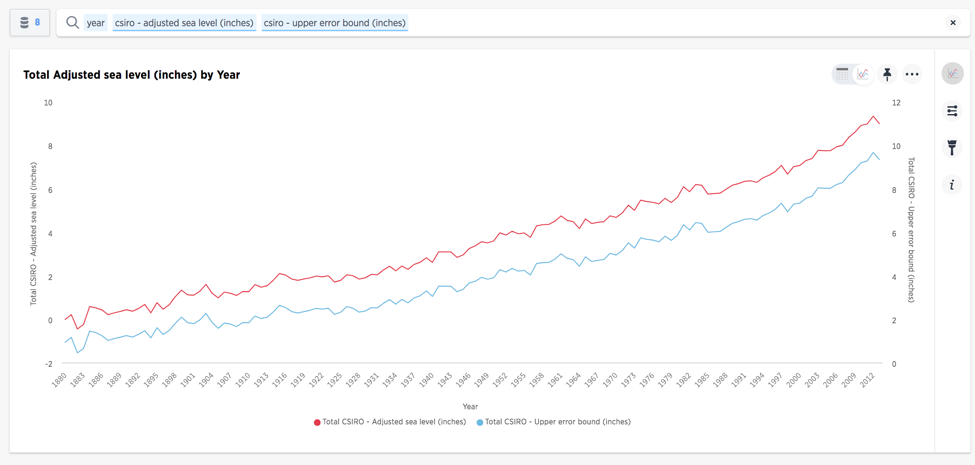
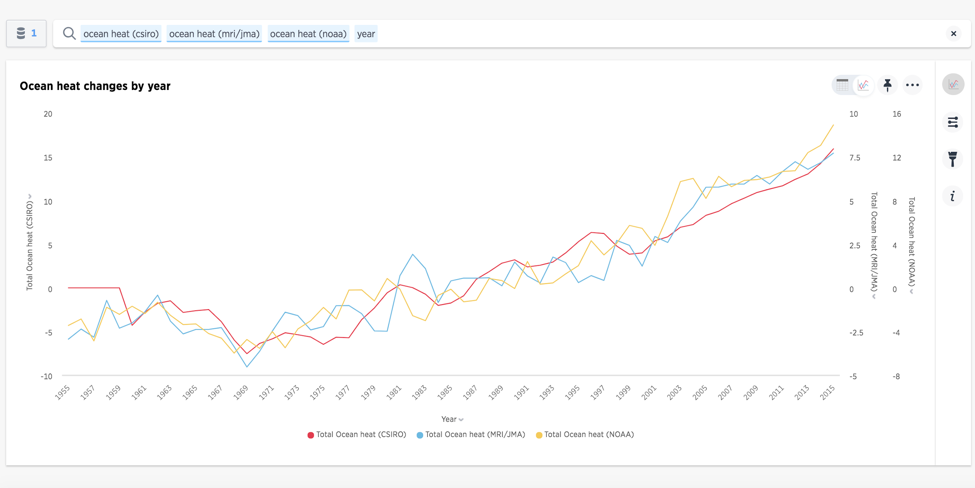
Below are two graphs about the ocean. Choose one of the graphs and explain two things:
1) What pattern does the graph show? (Just describe the big idea).
2) How it could explain why hurricanes are becoming more destructive? Use something we have learned about hurricanes in your explanation.
For a bonus point, explain both graphs and how they relate to hurricanes correctly:)
Graph A - Average Sea Level, by year from 1880 to 2012
Graph B - Average ocean heat, 1955 to 2015
Source: EPA: https://www.epa.gov/climate-indicators
Check-in: Think back. What is one specific activity that you have enjoyed doing in class during the "Natural Disasters" unit. (Volcanoes, Earthquakes & Hurricanes).
What is one thing you wish was different / you would change? (Something frustrating? Confusing? Something you wished we had talked about more?)