1
1
1
1
1
1
1
1
For Hania's Driver’s Education class, she finds data about the number of car accidents and fatalities (deaths) from car accidents for teens in the Western United States.

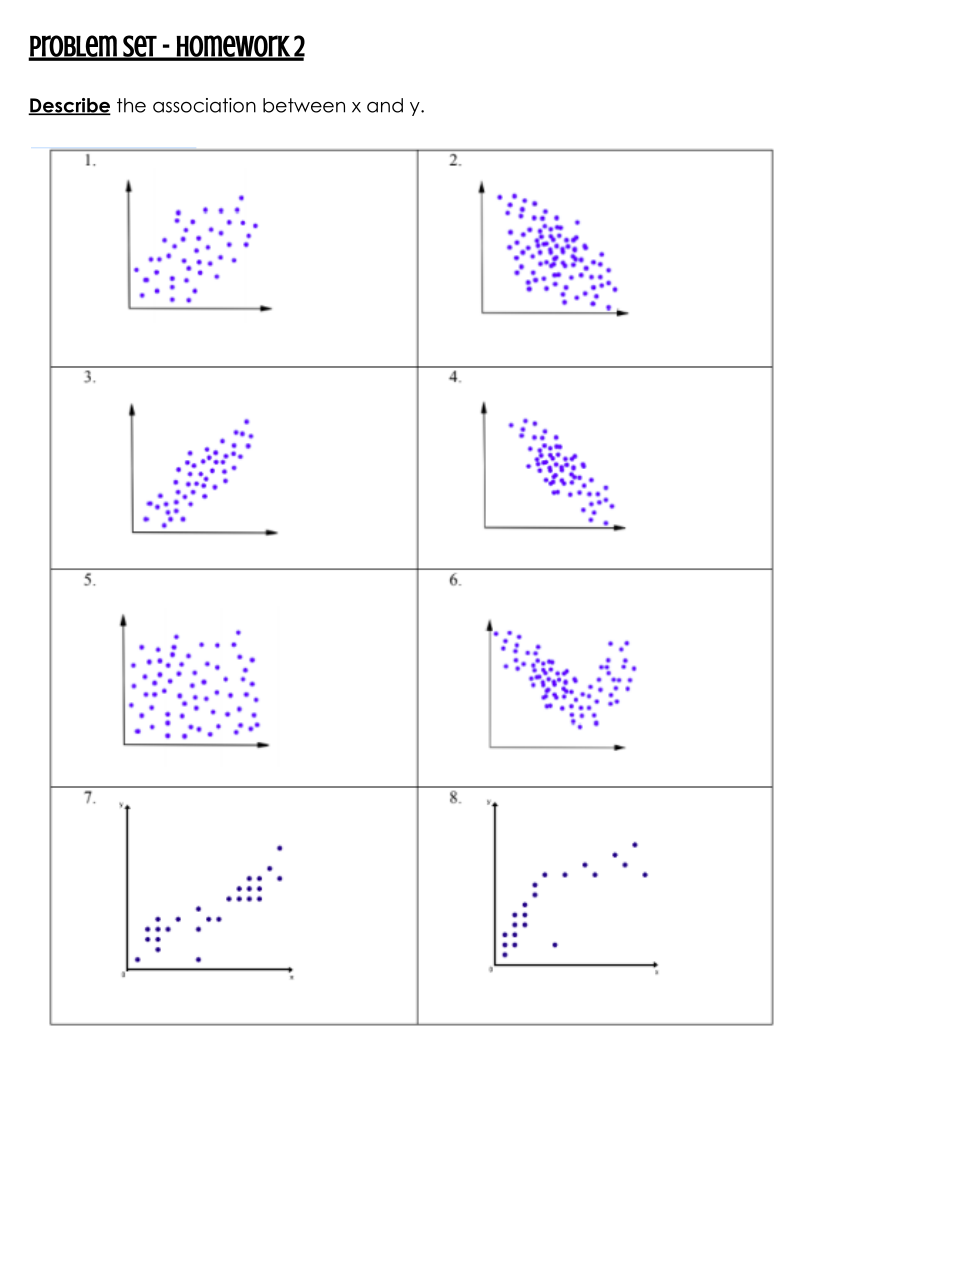
Describe the association between the two variables!
Make sure to use the actual variables in your response. For example, begin your response to this question by saying:
"The association between accidents and fatalities is ______________"
Fill in the blank with one of the options below:
Negative weak?
Negative strong?
Positive weak?
Positive strong?
Nonlinear?
Winning times for the Men’s Individual Swimming Medley in the Olympics from 1964-2008 are in the plot below. Michael Phelps’ times are the last two entries.

Describe the association between the two variables!
Fill in the blank with one of the options below:
Negative weak?
Negative strong?
Positive weak?
Positive strong?
Nonlinear?
Leo has a kiosk in the mall where he is selling Cell Phone Covers. He records how much money he makes (revenue) based on the price he charges for the covers.

Describe the association between the two variables.
Fill in the blank with one of the options below:
Negative weak?
Negative strong?
Positive weak?
Positive strong?
Nonlinear?
Using the straight line tool, draw a line of best fit through the data points that captures the general trend of the data.
Estimate the slope (m)
Estimate the y-intercept (b)
Write your prediction function in y = mx + b form!
What is y when x = 12?
Using the straight line tool, draw a line of best fit through the data points that captures the general trend of the data.
Estimate the slope (m)
Estimate the y-intercept (b)
Write your prediction function in y = mx + b form!
What is y when x = 12?
What is y when x = 100?
Create your scatterplot using the table provided and INCLUDE THE LINE OF BEST FIT

Be careful here!
Pay attention to how the x-axis is increasing!
Estimate the slope (m)
Estimate the y-intercept (b)
Write your prediction function in y = mx + b form!
Draw your line of best fit in RED
Estimate the slope (m)
Estimate the y-intercept (b)
Write your prediction function in y = mx + b form!
What does the slope represent in the context?
Describe the association between x & y
Describe the association between x & y
Describe the association between x & y
Describe the association between x & y
Describe the association between x & y
Describe the association between x & y
Describe the association between x & y
Describe the association between x & y
What is y when x = 100?
What does the y-intercept represent in the context?
Predict the weight of 50 widgets.