AN Section 9 and 10 Test
star
star
star
star
star
Posljednje ažuriranje over 2 years ago
36
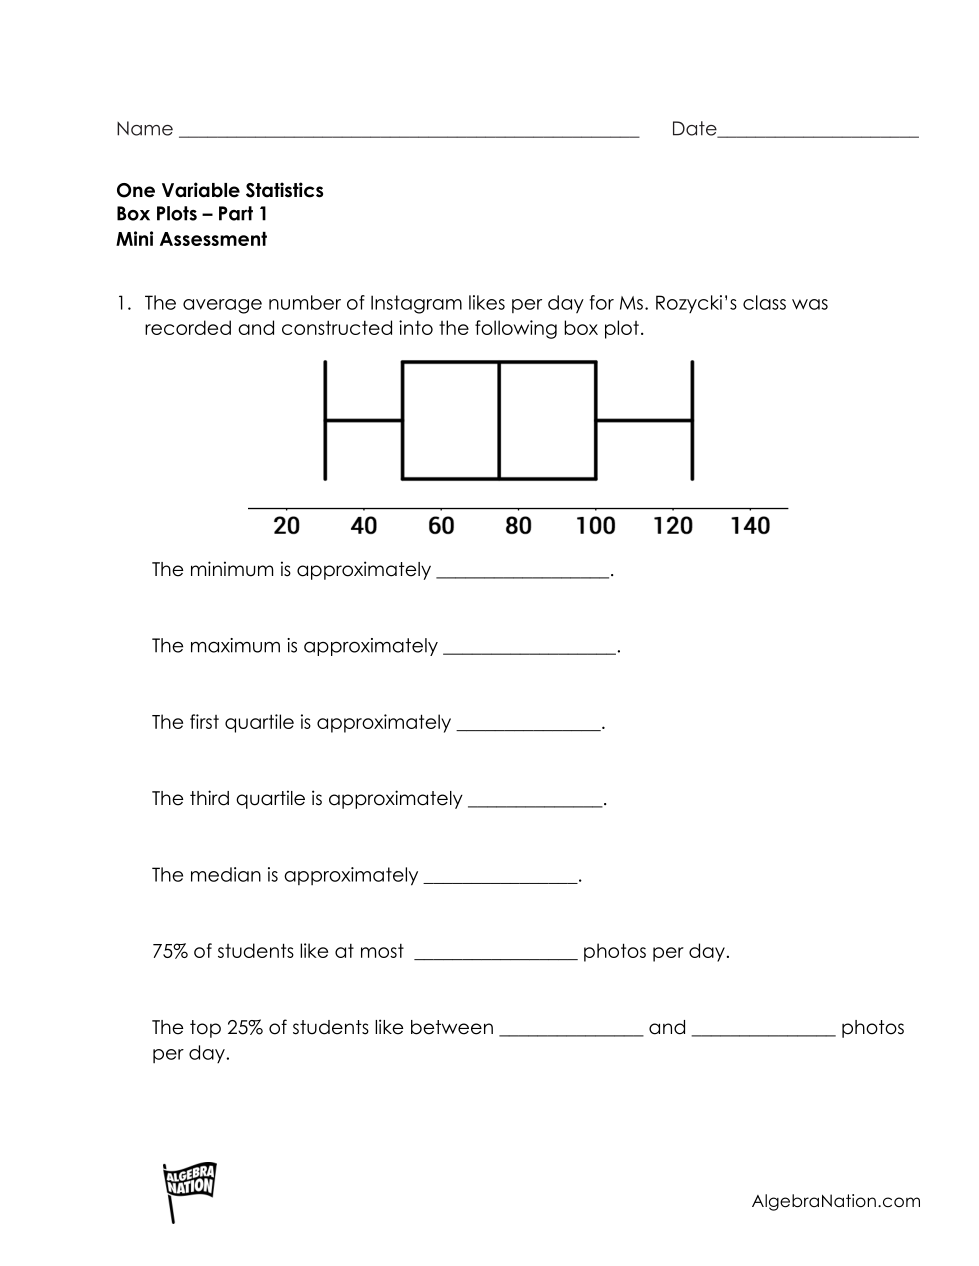
Minimum
First Quartile
Third Quartile
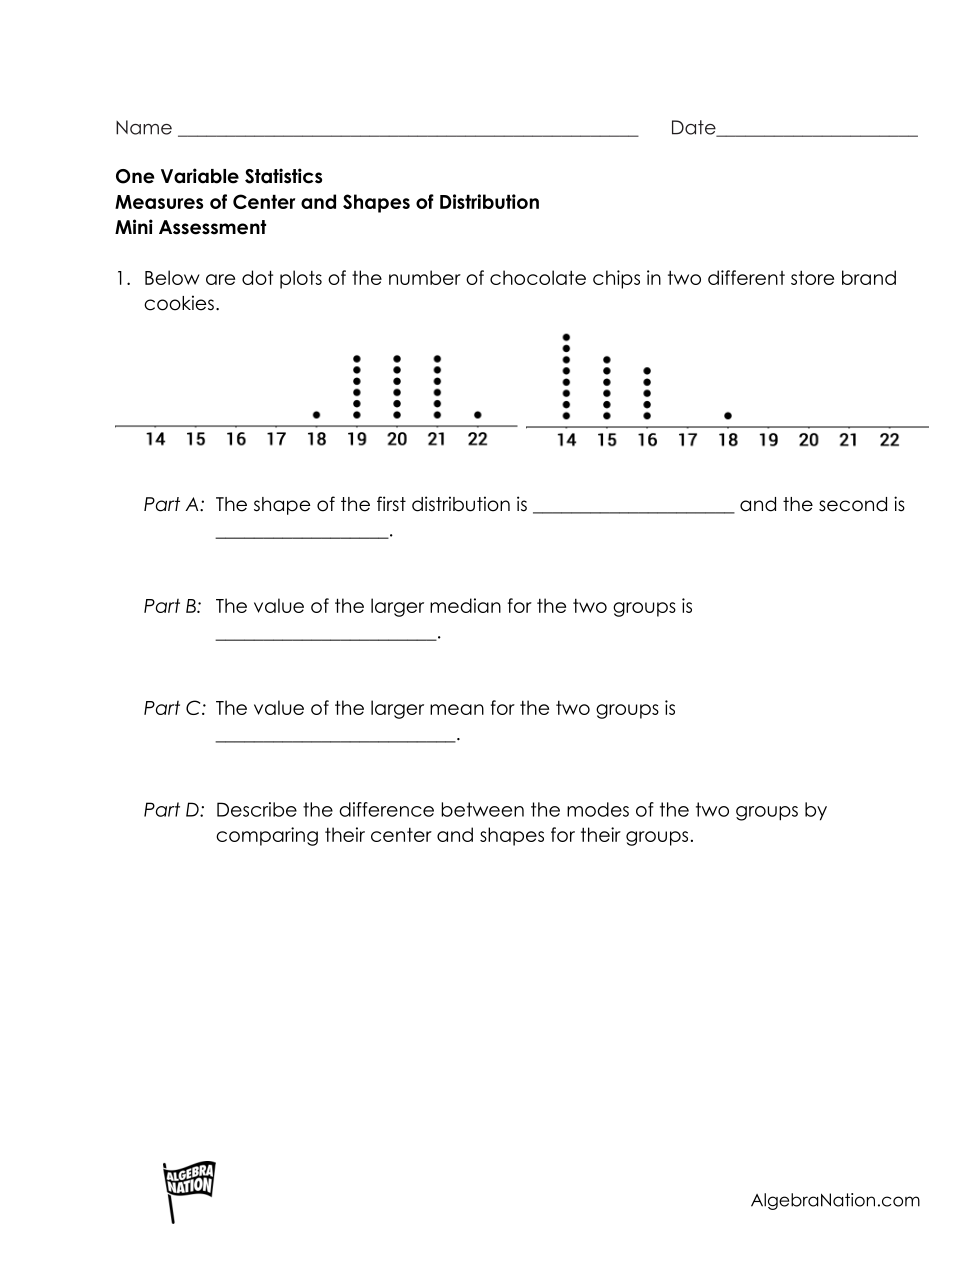
Describe the distributions of the first.
What is the value of the larger median?
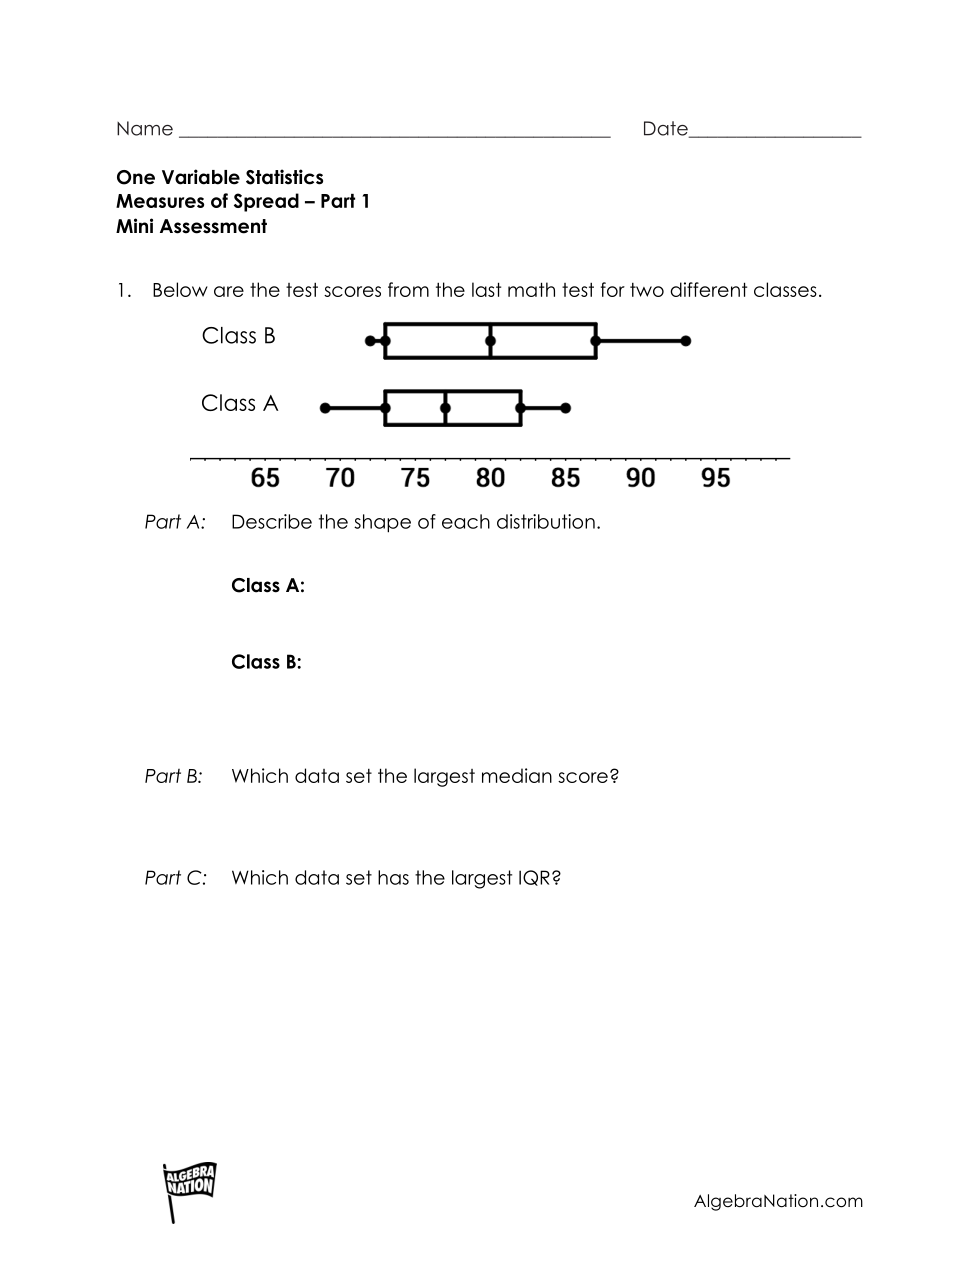
Describe the distribution of A.
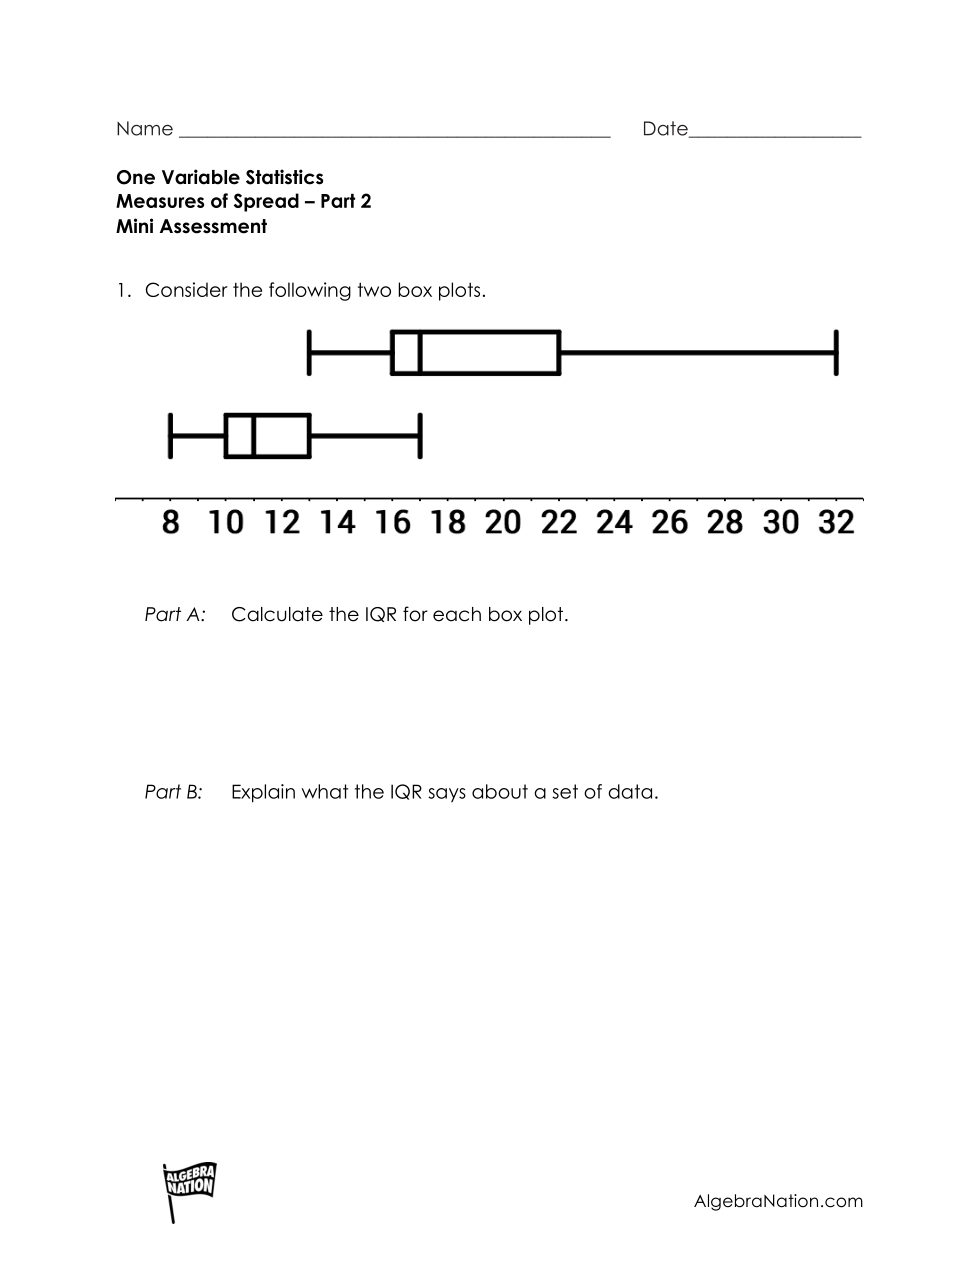
What is the IQR of the top box plot?
What is the IQR of the bottom box plot?
The outlier of the data set causes the ___ to be greater than..
...to be greater than the ___ when the outlier is in the upper part of the data set.
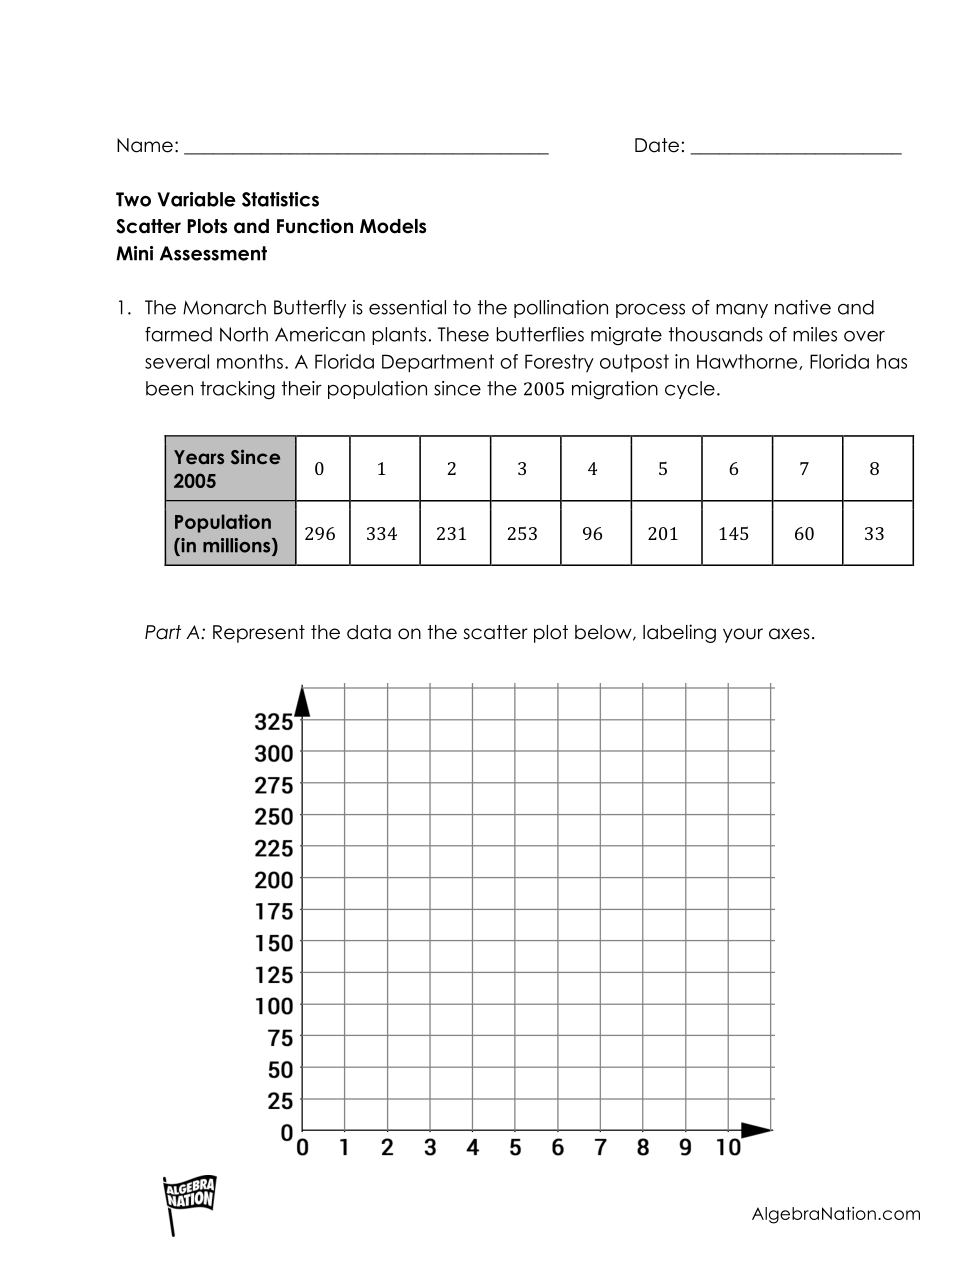
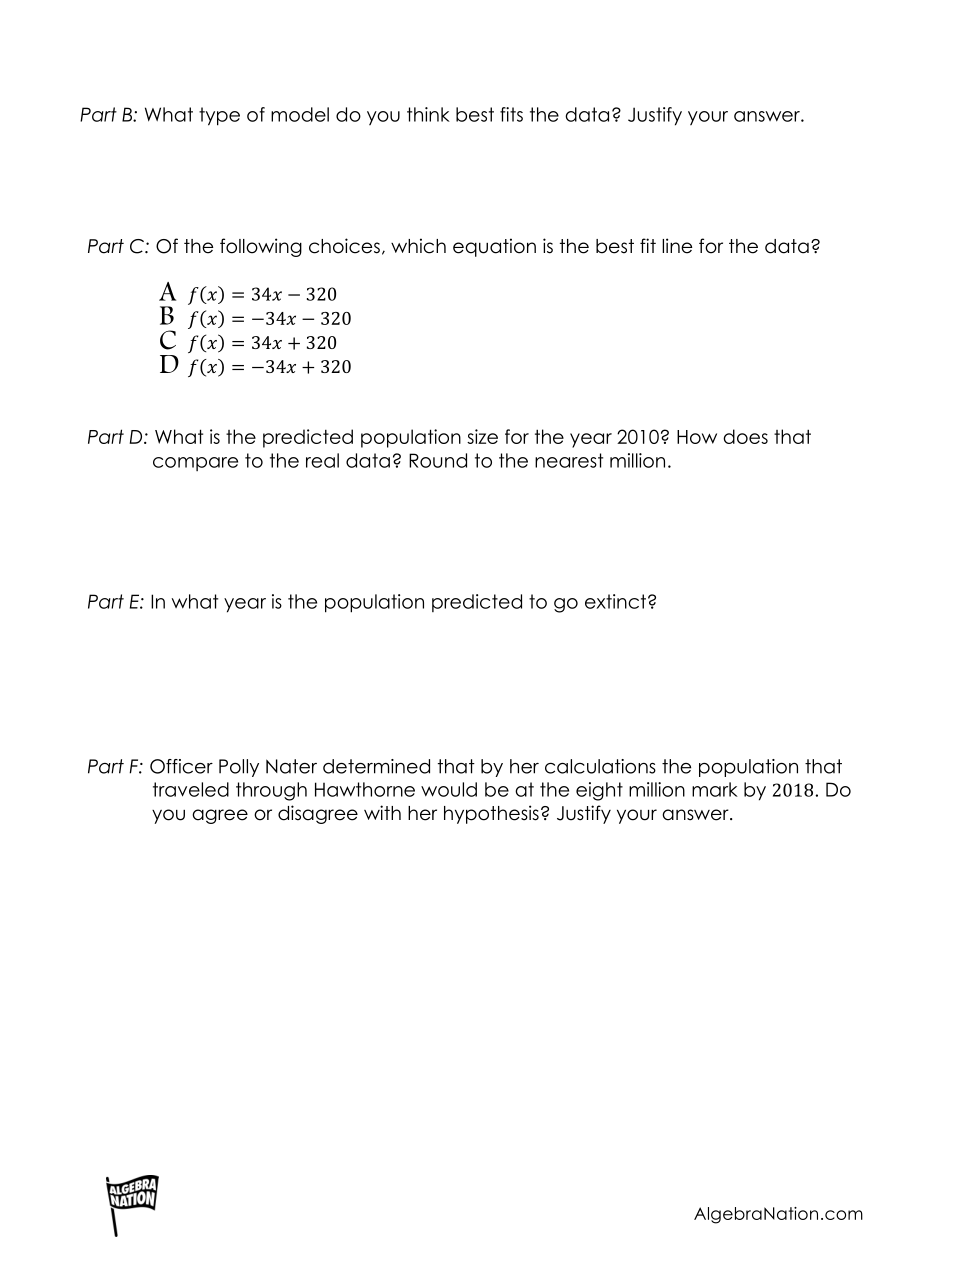
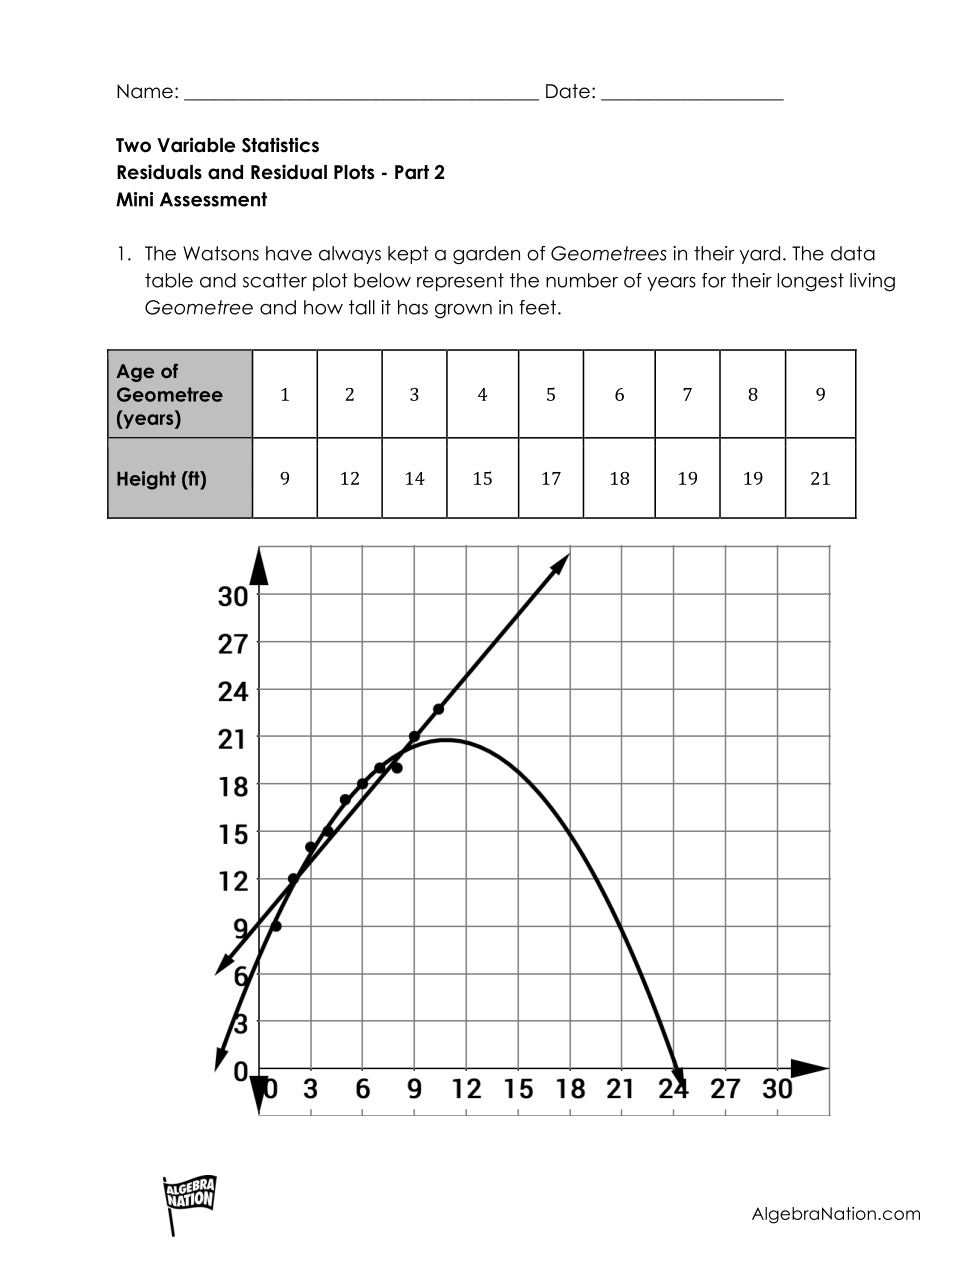
Which equation is the best fit line for the data?
What is the predicted population size for the year 2010?
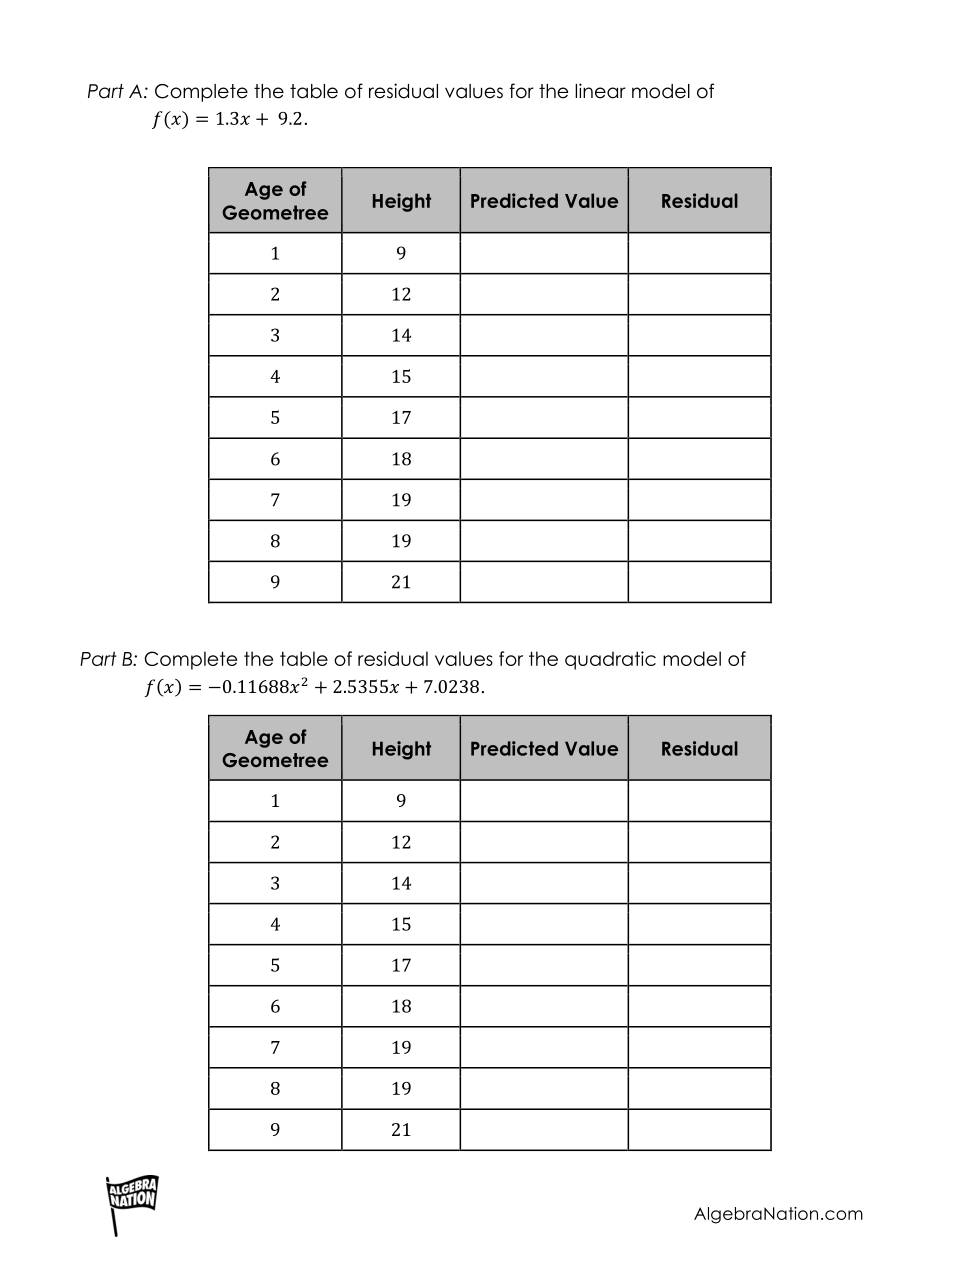
Predicted Value
Residual
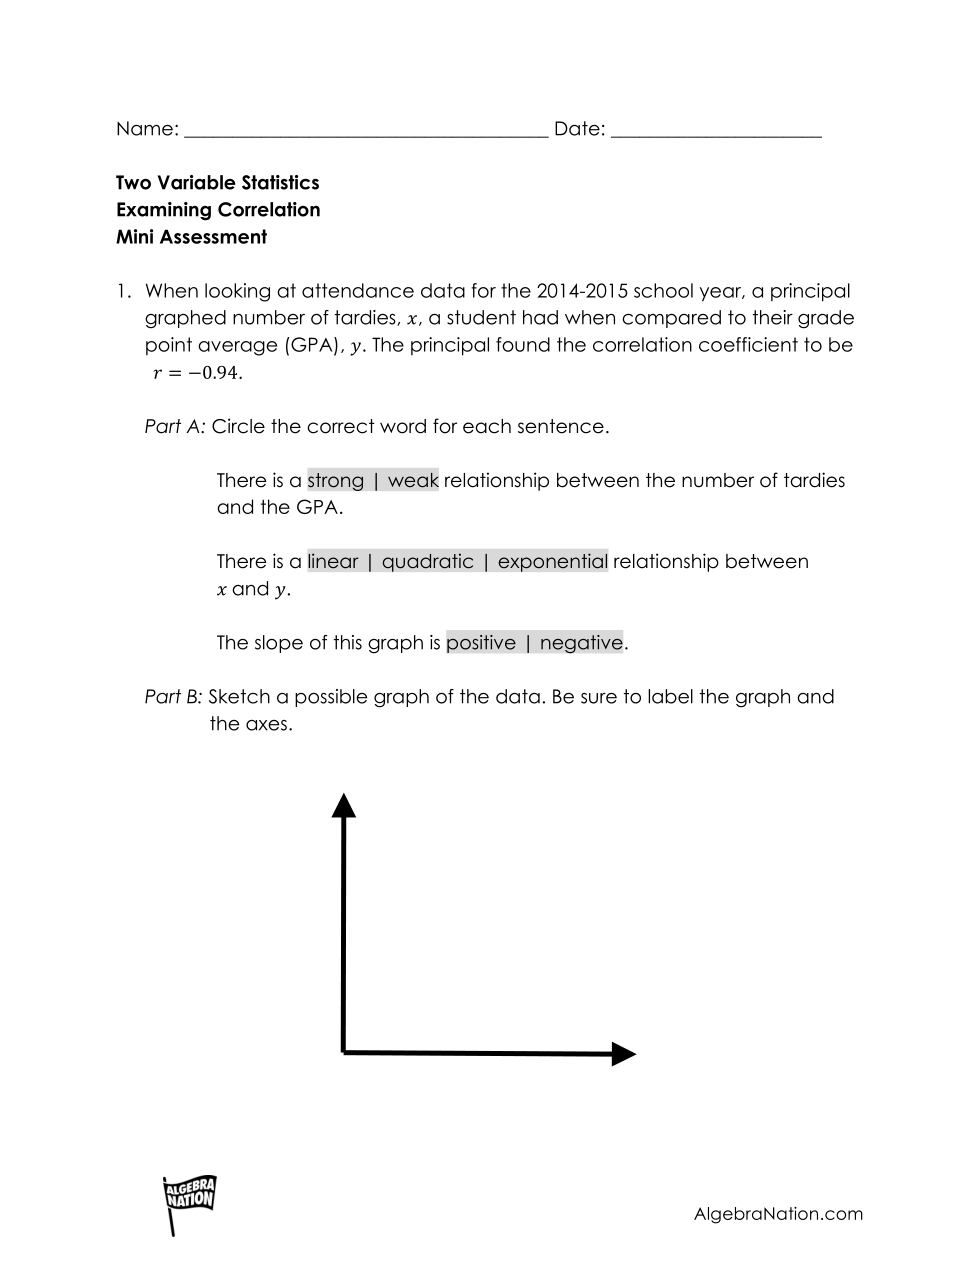
What kind of relationship?
The slope is___
75% of students like at most ___ photos per day
The top 25% of students like between __ and __ photos per day.
Describe the distributions of the second.
What is the value of the larger mean?
Describe the distribution of B.
Which has the largest median score?
Which has the largest IQR?
An outlier has a greater effect on the ___
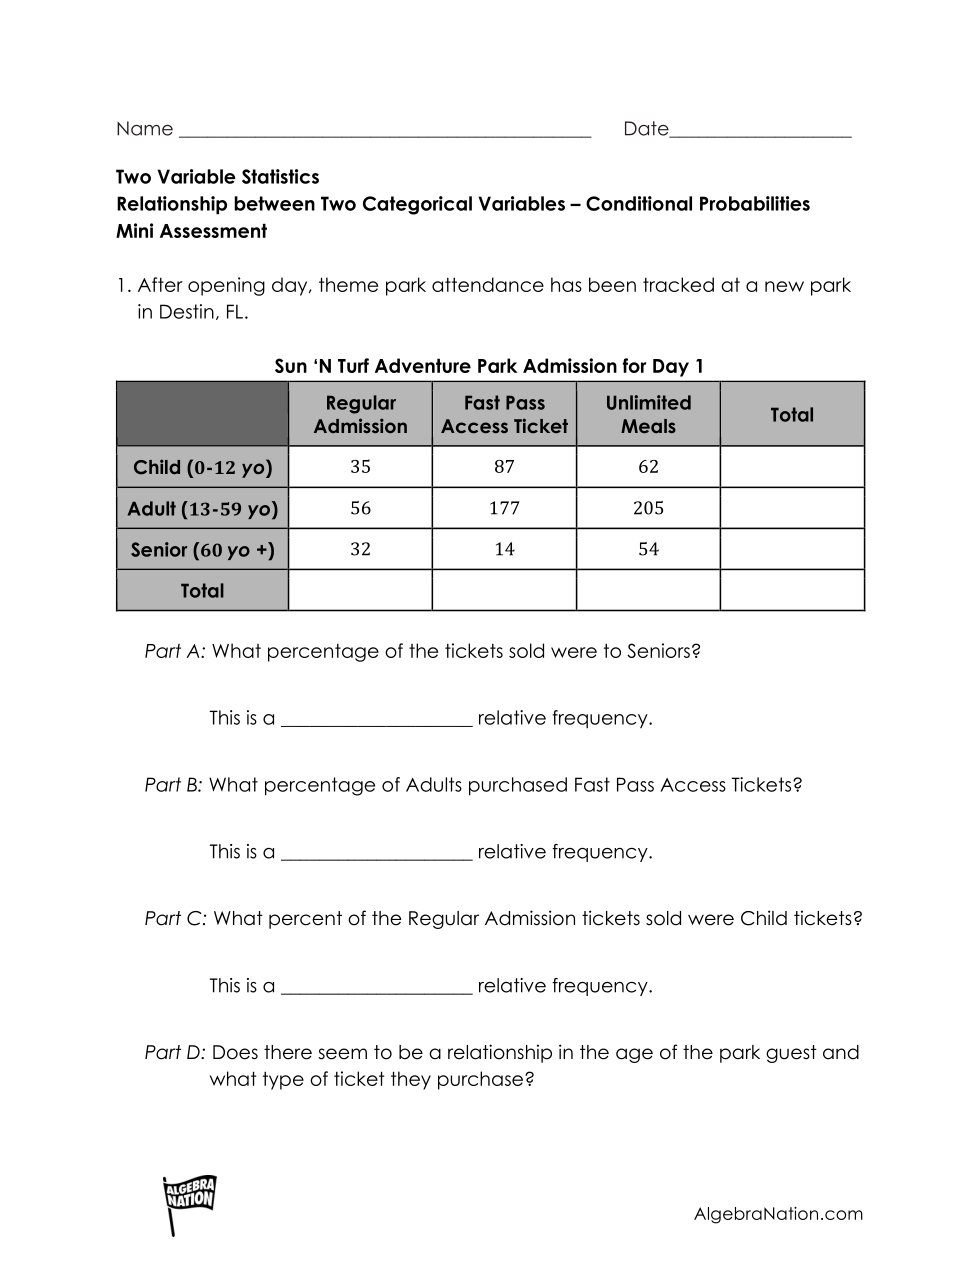
Fill in the correct number for the table.
Fill in the correct number for the table.
Fill in the correct number for the table.
Fill in the correct number for the table.
Fill in the correct number for the table.
Percent rounded to nearest tenth.
What type of relative frequency?
Percent rounded to the nearest tenth.
What type of relative frequency?
What type of relationship?