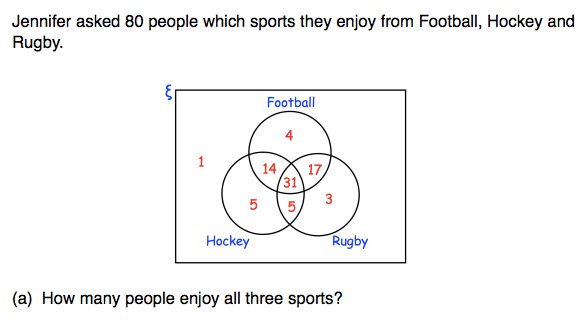
1
(a) How many people enjoyed all three sports?
(a) How many people enjoyed all three sports?
1
1
(a) How many people enjoyed all three sports?
There are 80 students in the Junior class at Hoffman High School.
9 students study French and German.
35 students only study French.
2 students do not study French nor German.
Draw a Venn Diagram to show the data of this sample:
How many students study only German?
How many students study at least 1 language?
What is the probability that a randomly selected student studies both French and German?
A gym runs 2 fitness classes, spin and circuits.
On Saturday, 100 people visited the gym.
18 people attended spin class.
10 people attended both classes.
58 people did not attend either class.
Draw a representation of this in a Venn Diagram:
What is the probability that a randomly selected person attended only circut class?
What is the probability that a randomly selected person attended exactly 1 class?
What is the probability that a randomly selected person attended spin class, given that they attended circut class?
Research 'conditional probability' to help you with this if you are stuck!
Callaghan High School has 1,200 students.
1,000 students at Callaghan High School got a Covid vaccine,
100 students at Callaghan High School got Covid,
and 2 students were in both groups.
Draw a Venn Diagram of the situation:
What is the probability that a randomly selected student from Callaghan High School got Covid?
Optional: See this video for extra help about Probability when looking at your Venn Diagram https://www.youtube.com/watch?v=pRoHVTJcMLY
Given that the student got the Covid vaccine, what is the probability that a randomly selected student from Callaghan High School got Covid?
Given that the student got Covid, what is the probability that a randomly selected student got the vaccine?
A random sample of 100 US schools gives us the following information:
14 are overcrowded,
52 have the majority of students on a free lunch program,
and 13 are both.
Draw a Venn Diagram of the situation:
What is the probability that a randomly selected school is not overcrowded?
Given that the selected school is overcrowded, what is the probability that the majority of students are on the free lunch program?
Given that the majority of students are on the free lunch program, what is the probability that the school is overcrowded?
Use online resources and describe in words what P(A|B) means: (You can look here as well: https://www.khanacademy.org/math/statistics-probability/probability-library/conditional-probability-independence/v/calculating-conditional-probability)
Use online resources and describe in words what P(B|A) means:
OPTIONAL: Solve the following probability

OPTIONAL: Solve the following probability

(b) How many people enjoy football and hockey but not rugby?
(c) How many people enjoy football or rugby?