Beverly did a study this past spring using data she collected from a cafeteria. She recorded data weekly for ice cream sales and soda sales. Beverly found the line of best fit and the correlation coefficient, as shown in the diagram below.
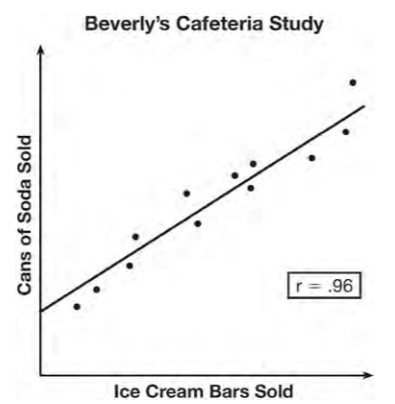
Given this information, which statement(s) can correctly be concluded?
I. Eating more ice cream causes a person to become thirsty.
II. Drinking more soda causes a person to become hungry.
III. There is a strong correlation between ice cream sales and soda sales.
Beverly did a study this past spring using data she collected from a cafeteria. She recorded data weekly for ice cream sales and soda sales. Beverly found the line of best fit and the correlation coefficient, as shown in the diagram below.
Given this information, which statement(s) can correctly be concluded?
I. Eating more ice cream causes a person to become thirsty.
II. Drinking more soda causes a person to become hungry.
III. There is a strong correlation between ice cream sales and soda sales.