
What do we use to measure temperature?
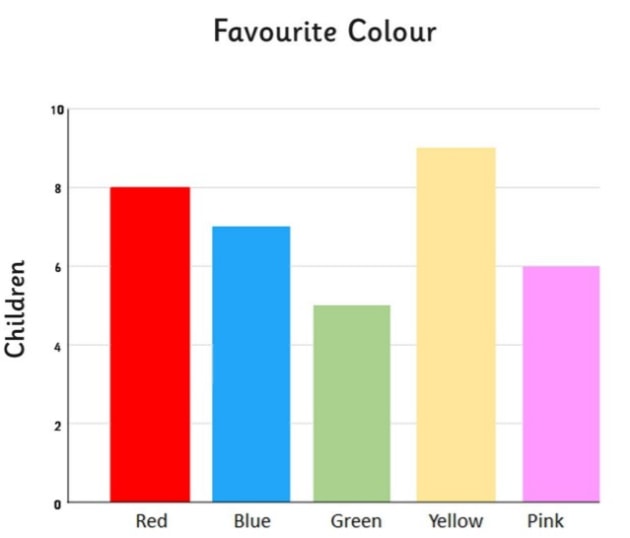
What type of graph does the above picture show?
What type of graph does the above picture show?
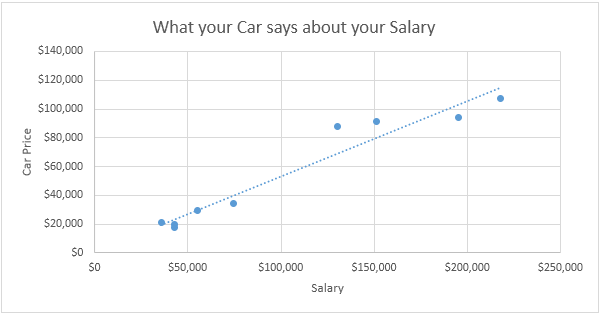
What type of graph does the above picture show?
What does a solid become when it is heated?
What does a liquid become when it is heated?
What does a liquid become when it is cooled?
What is the best meaning of melting point?
What is the meling point of water?
What is the boiling point of water?