I do: Describe, in detail, how the number of cases of TB changed worldwide from 1980 to 2005 (3 marks)
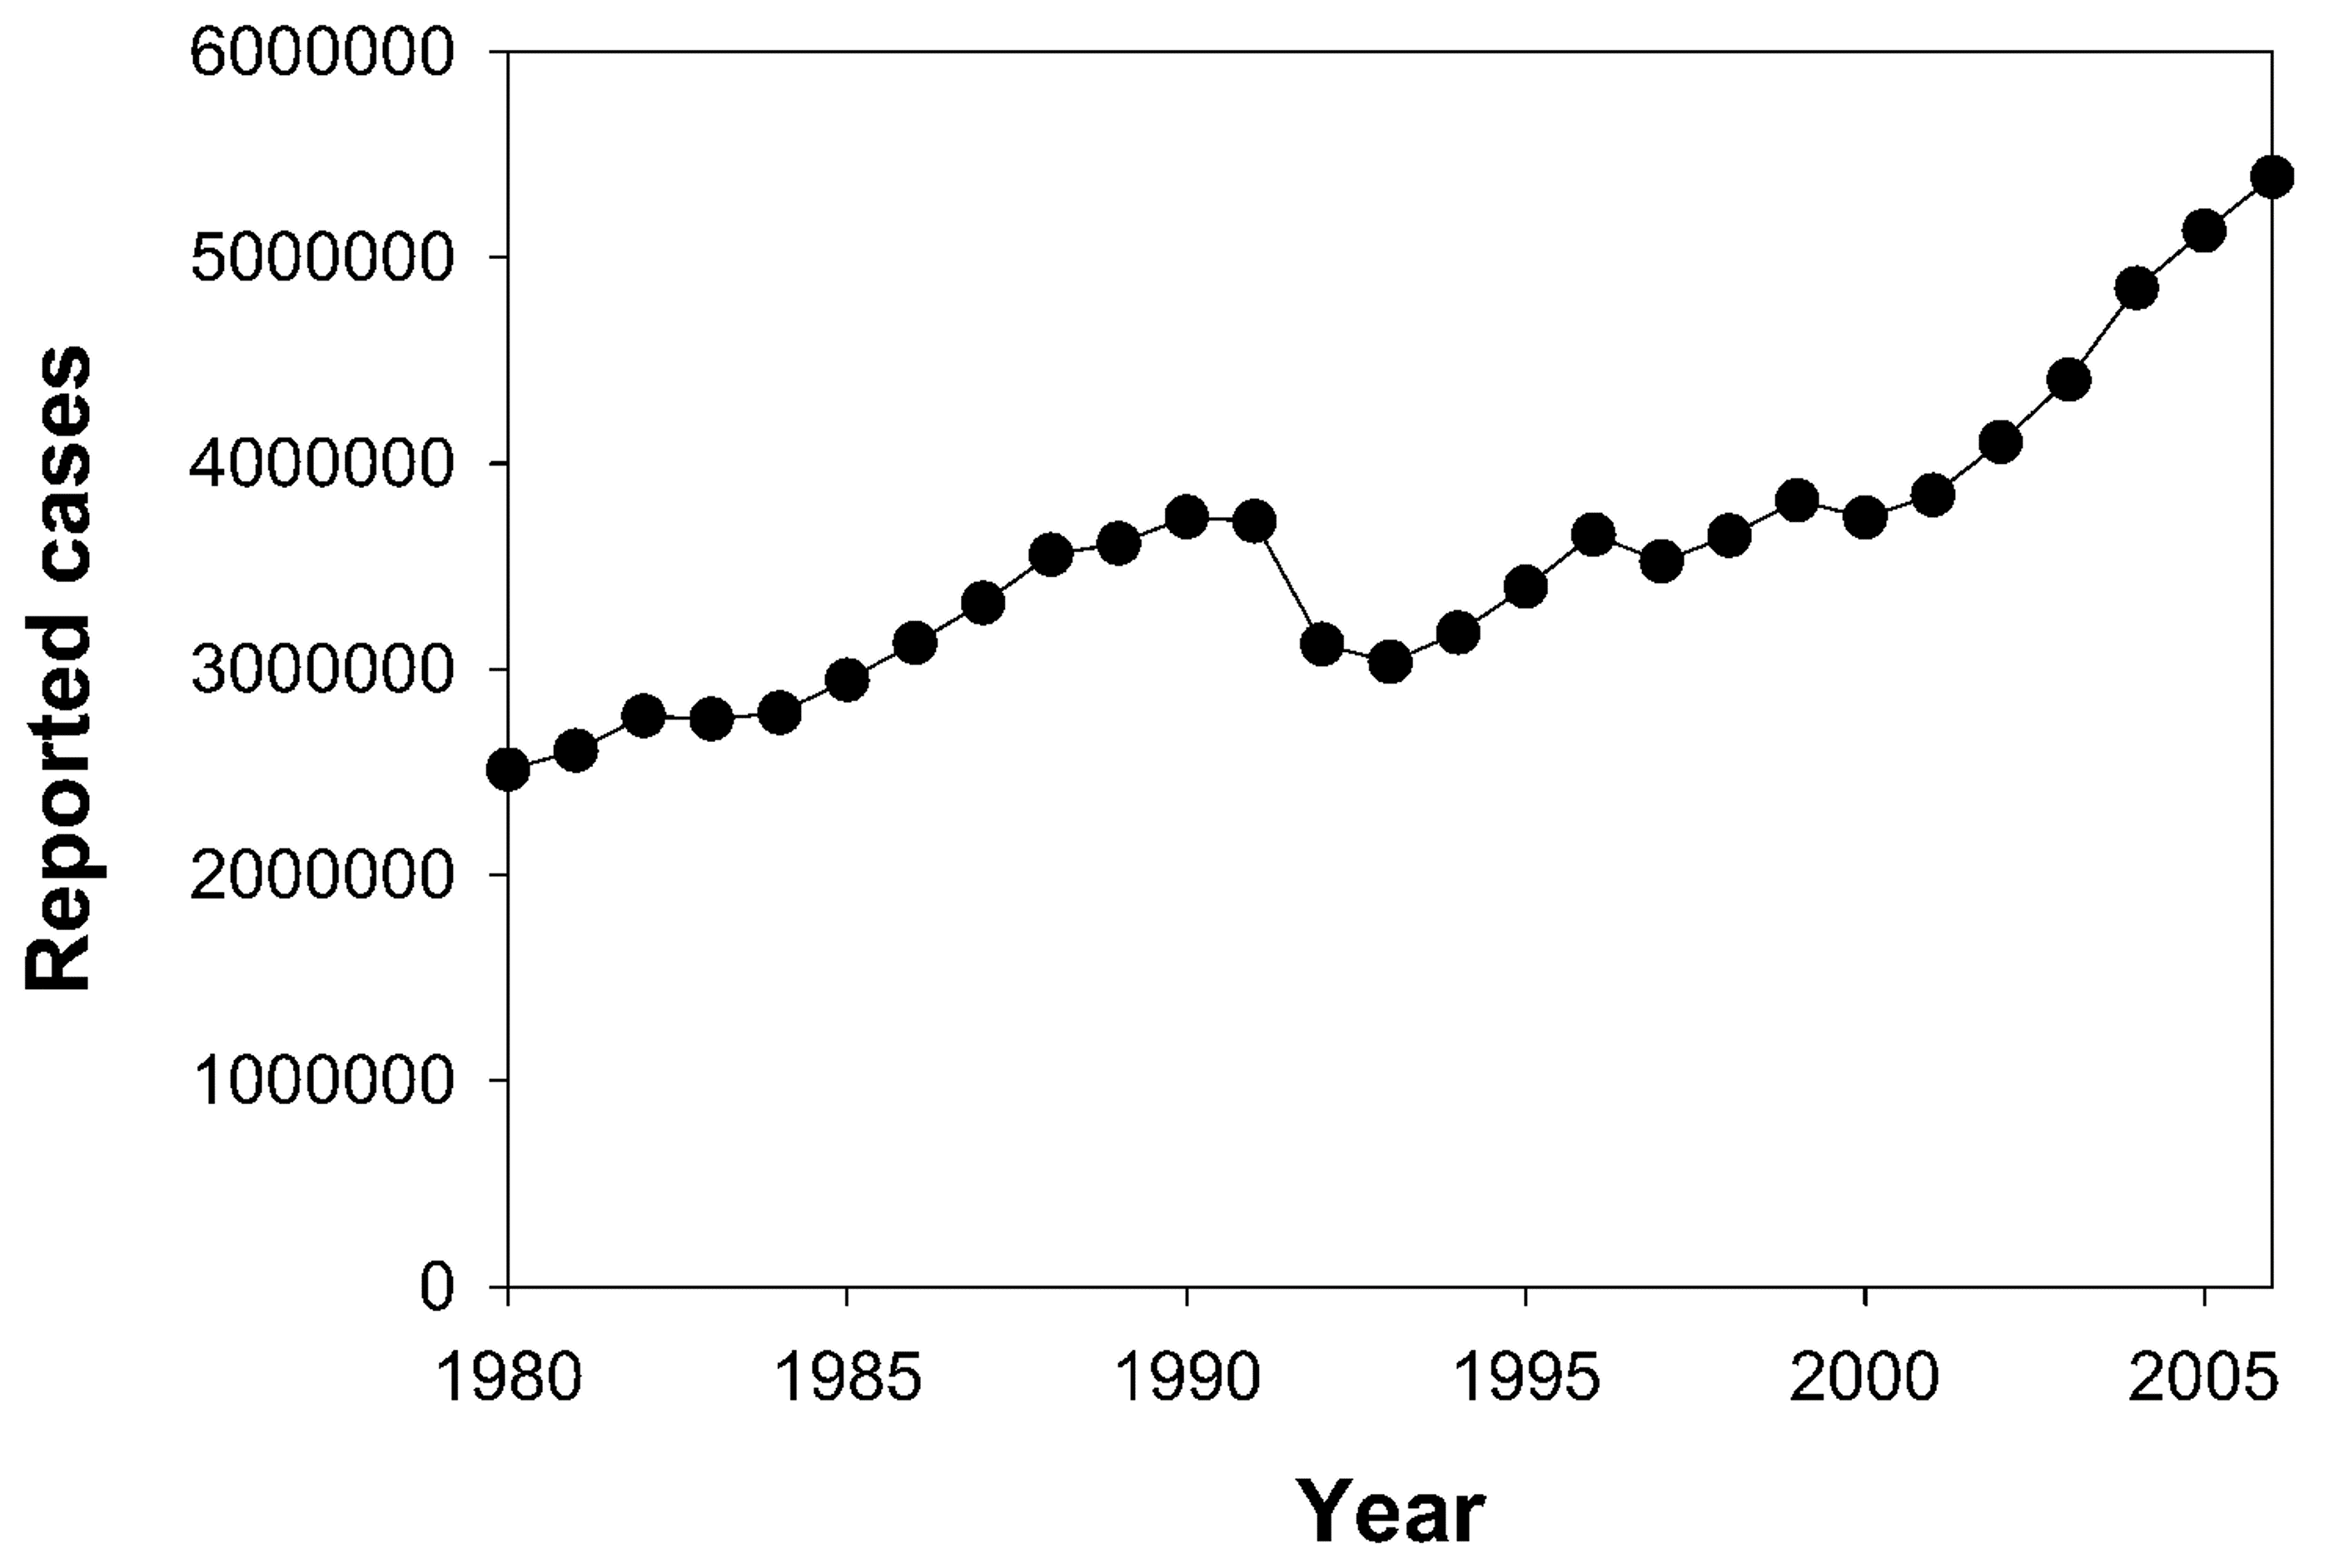
I do: Describe, in detail, how the number of cases of TB changed worldwide from 1980 to 2005 (3 marks)
1.What plant does the heart drug digitalin come from?
2. What does dosage mean?
3. A new medical therapy is invented, what must be done before it is used on patients?
4. What is an antibiotic?
5. Write the equation that links magnification, actual size of object and image size of object.
When is a bar graph used?
When is a scatter graph used?
What is continuous data?
What is discrete data?
What type of graph would be used to represent this data?
What type of graph would be used to represent this data?
What type of graph would be used to represent this data?
I do: Describe, in detail, how the number of cases of TB changed worldwide from 1980 to 2005 (3 marks)
We do: Describe, in detail, how the number of deaths from cardiovascular disease in the US has changed from 1968 – 2016. (3 marks)
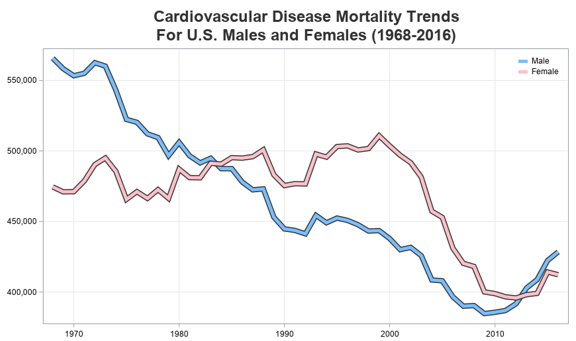
•From 1970 until 2008….
•Except for two small increases in…
•From 2010 onwards…
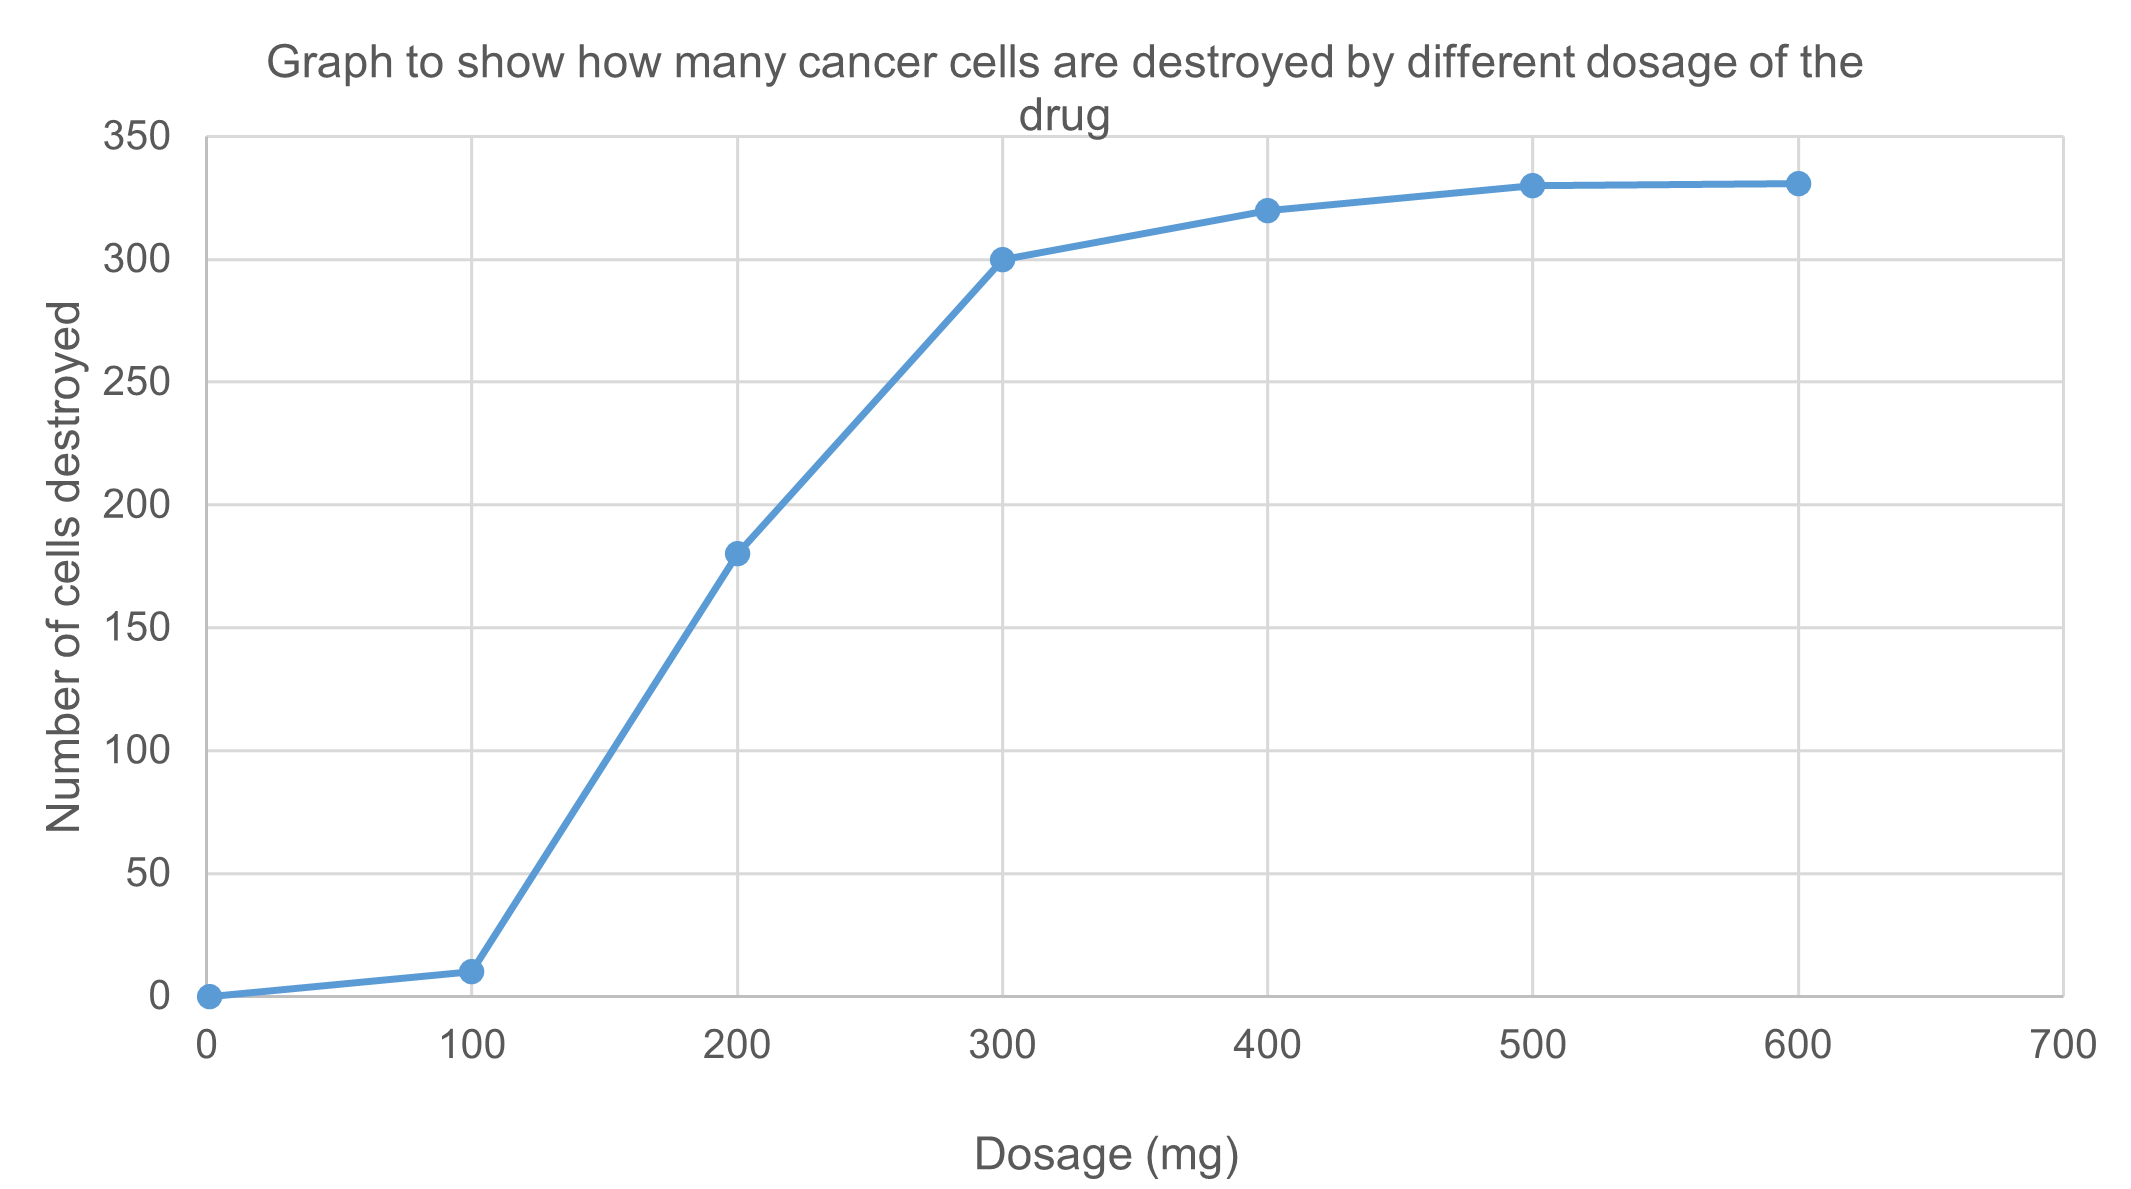
You do: Describe, in detail, how the number of cancer cells destroyed changes when the dosage of a drug changes (3 marks)
1. We plot a scatter graph of data when the independent and dependent variables are…
2. Describe a positive correlation
3. What is discrete data?