Preskoči na glavni sadržaj
Prijava
Sign up for FREE
arrow_back
Biblioteka

USE THIS ONE!1.2 Analyzing Data and Graphs

star
star
star
star
star
Posljednje ažuriranje almost 4 years ago
40

EXPLORE-1 ( 5-7 minutes)

Where do people live? How populated is it?

Guided Instruction-1

(10-15 minutes)

Calculating Population Density

EXPLORE-2 (15-20minutes)

Where is water located on Earth?

1
Pitanje 1
1.

Take pictures of any paper copies here if you did this on paper. If you didn't do this on paper you can skip it!

Working Collaboratively to Help Everyone Learn

1
Pitanje 2
2.

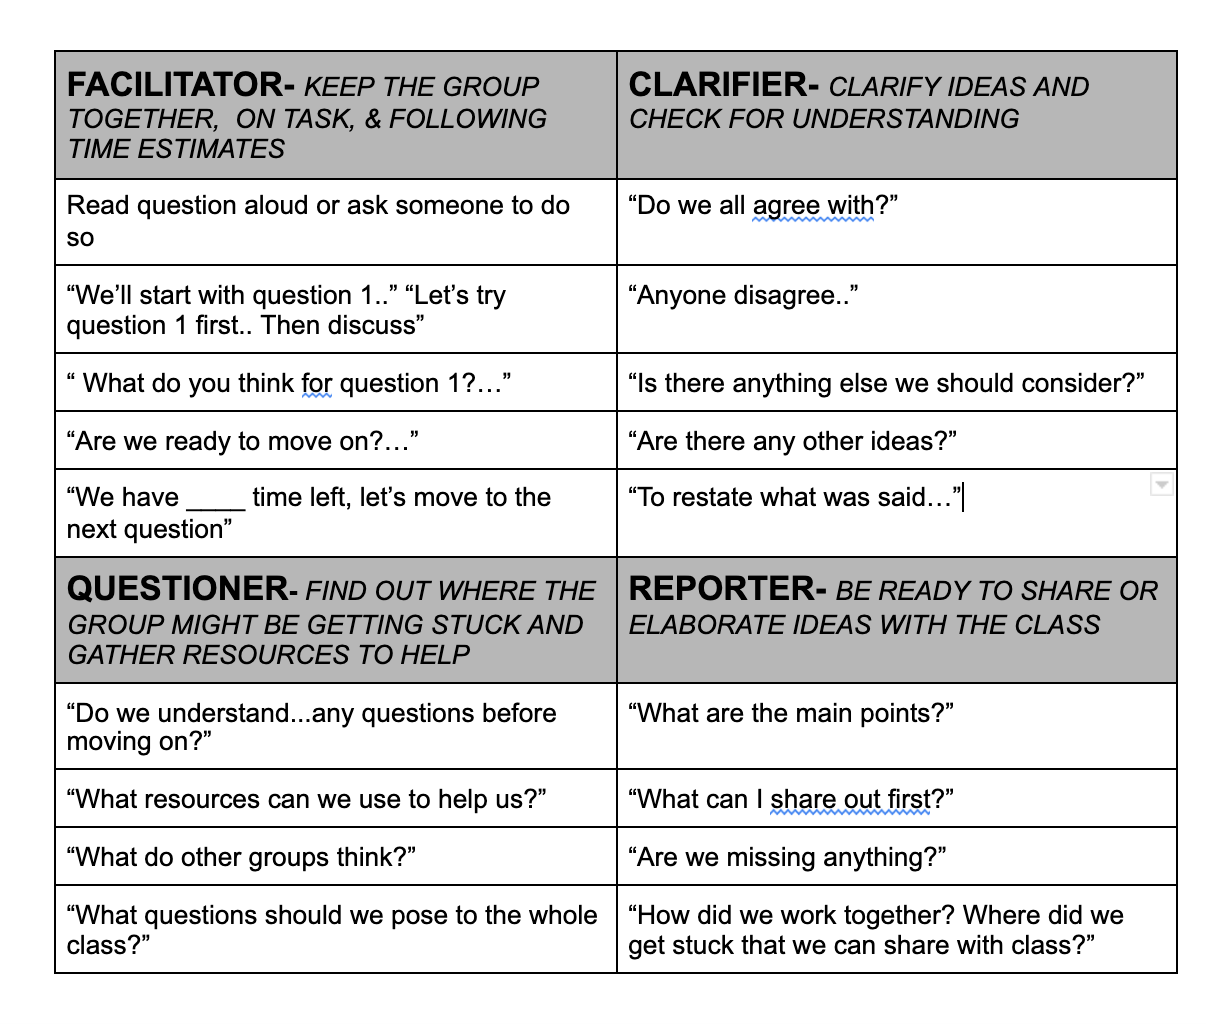
Review the norms and use your Stem thinking to think about how to work together in your group and what to do when an individual or the group feels stuck.

One norm to use can be...

When stuck, we can first... second...third

Essential Question

Why are people forced to move?

HS-ESS2-2. Analyze geoscience data to make the claim that one change to Earth's surface can create feedbacks that cause changes to other Earth systems.

Learning Target

I can ask questions that arise from analyzing maps and data related to sea level rise

EXPLORE 1- Population Density Maps

G.I. 1- Calculating Population Density

EXPLORE 2- Exploring where water is on Earth

G.I. 2- Analyzing sea vs. land ice

Review the group roles. We will be looking to see that you're working together and should be able to tell your role based on how you interact with your group.

1- Facilitator

2- Questioner

3- Clarifier

4-Reporter

* If working in a group of 3, # 3 can be the reporter and clarifier. If you're missing a number for your group, make sure that someone takes on two roles to account for the missing role(s).

1
Pitanje 3
3.

What is your group role?

1
Pitanje 4
4.

What do you want to be mindful about for your role?

1
Pitanje 5
5.

Look carefully at the key. What do these colors on the map represent?

The colors represent…

1

View the 5 images of land masses around the world below and then answer questions 3 and 4.

1
Pitanje 7
7.

What parts of each land mass seem to have more people?

People live around….

In each land mass...

1
Pitanje 8
8.

Explain how you know? Which specific data are you using from the maps?

I know this because…

I looked at …. on each map because...

1
1
Pitanje 10
10.

Calculate the population density for Location A. (Louisiana)

1
Pitanje 11
11.

Calculate the population density for Location B (Panama)

1
Pitanje 12
12.

Calculate the population density for Location C (India)

1
Pitanje 13
13.

How does knowing the population density of each community help us to better understand the problem and how to best support these communities?

Population density can help us understand the problem by…

Population density is useful when considering…

1
Pitanje 14
14.

Is there any other information we should consider when trying to help communities large or small?

Something to consider is...

Sea level rise is an issue in all these communities. Read the slide to see how scientists have measured changes in sea level over time.

1
Pitanje 15
15.

What do you notice about the graph?

The x-axis shows...

The y-axis shows...

The slope of the graph shows...

1
Pitanje 16
16.

What do you predict that you'll see in the data 20 years from now?

In 20 years I'd expect sea level to _____ compared to today

1
Pitanje 17
17.

Watch this animation of the Earth rotating.

Where is water located on Earth? Where is most of the water? What are other sources not seen on this animation?

Water is located...

Most water is...

Other sources of water could be...

1
Pitanje 18
18.

What do you notice about Earth's hydrosphere? Where is water located? Where is most of the water, least of the water? (Use specific evidence from the graph)

I notice that...

Water is located in...

The most water is in...

The least water is in...

1
Pitanje 19
19.

Where is most ice found on Earth?

1
Pitanje 20
20.

If ice is contributing to sea level rise over time, what do you think you would see change if you could watch the ice?

I think I would see..

One change over time could be...

1
Pitanje 21
21.

Watch the video of the Earth. What do you notice about how the Arctic (North Pole) ice is changing over time?

The ice is changing by...

I can see that...

The red graph line shows...

GUIDED INSTRUCTION-2

15-20 MINUTES

How is ice changing at both poles? Is there a difference between sea vs. land ice?

Watch this video of damage along the Northeast from hurricane Ida

1
Pitanje 22
22.

What do you think? Could ice melt at the North and South Poles contribute to these storms?

The graph shows Changes in sea ice at each pole during the summer months.

Sea ice is ice located in glaciers within the ocean.

1
Pitanje 23
23.

What does the blue line represent?

1
1
Pitanje 25
25.

This graph represents Sea Ice Changes at the two Poles.

What do you notice about the graph? (Any patterns or trends? Similarities and Differences between Arctic and Antarctic etc.)

I noticed that...

One pattern is..

The two graphs are similar because...

One difference between the two graphs is...

1

Watch this video showing changes in land ice from 2002-2016. This video and graphs represent land ice changes in both Greenland (North Pole) and Antarctica (South Pole).

Land ice is ice located on the land and not in the ocean.

1
1
Pitanje 28
28.

What patterns/trends do you notice in the changes in mass of ice over time? What are similarties and differences between ice mass loss in Greenland versus the Antarctic?

I notice that...

One patterns is...

One similarity is...

One difference is...

1
1
Pitanje 30
30.

Explain your reasoning for question 27 using two pieces of evidence.

One piece of evidence is...

Another piece of evidence is...

1
Pitanje 31
31.

Record 1-2 questions about the data.

1
1
1
1
1
Pitanje 36
36.

What is one thing that you can improve upon in using your group role?

1
1
Pitanje 38
38.

What is one way your group can improve working together?

1
Pitanje 39
39.

What is one thing you GOT from the Explore 2 and Guided Instruction 2

- Something you understand or think you could explain to someone else

1
Pitanje 40
40.

What is one Need, or question(s) you have? List specific question(s) you want to review as a class.

Pitanje 6
6.

What patterns do you notice about where people live?

Choose all that apply

Pitanje 9
9.

Slide H shows the population density or how many people live in a certain area for our three communities. What could you do to calculate the population density?

Pitanje 24
24.

What does the red line represent?

Pitanje 26
26.

What do the colors represent on each land mass? Choose all that apply.

Pitanje 27
27.

Based on the video and images, what is true about the colors on the key? Choose all that apply

Pitanje 29
29.

Compare land ice changes at each Pole? Greenland vs. Antarctica Choose all that apply

Pitanje 32
32.

Look back at Slide U (sea ice) and Slides V and W (land ice).

Compare sea ice to land ice. What do you notice? What do you wonder?

Sea ice is... compared to land ice...

I notice that...

I wonder about..

Pitanje 33
33.

What could be a reason for differences in land and sea ice between the two Poles? (Greenland vs. Antarctica)

One reason for a difference between the poles could be...

The North Pole might have...ice than the South Pole because...

Pitanje 34
34.

In general, what would you claim is happening to the average rate of rise in sea level over time?

Pitanje 35
35.

Reflection: How would you rate yourself on how you performed your group role?

Pitanje 37
37.

How would you rate the collaboration in general from your group?