Log in
Sign up for FREE
arrow_back
Library
QUIZ CRYPTO BASIC
By Harry Bandukda
star
star
star
star
star
Share
share
Last updated over 4 years ago
15 questions
Add this activity
1
1
1
1
1
1
1
1
1
1
1
1
1
1
Question 1
1.
What is a Candlestick Represents ?
A Candlestick represent a guide to draw trendlines.
A Candlestick represent support and resistance so a trader can take profitable trades.
A Candlestick represents a scenario of the market whether a bullish market or bearish.
A Candlestick is a representation of a certain timeframe.
Question 2
2.
How many points does a candle stick have
1 and some times 2
ZERO
4 only
TEN
Question 3
3.
What is the difference between a Bullish candle and a Bearish candle ?
A bullish candle is open high and closes low and a bearish candle is open low and closes high
A bullish candle is open low and closes high and A bearish candle is open high and closes low
A candlesticks have similar bodies and whicks.
None of the above.
Question 4
4.
Candlestick is made of two thing _______ and _________
Wax and Glass
Body and Wink
Body and Green color
All of the above
Question 5
5.
n daily time frame we have a candle represent 24hrs. How many candles are needed in 4hr time frame that would complete that 24hrs?
12 candles
8 candles
6 candles
16 candles
Question 6
6.
If the candle close price is higher than the open price the candle will be bullish
True
False
Question 7
7.
What does a market or price action tells you?
Movement of the price over time.
Helps to build signals like entry and exit point.
It is the form of technical analysis.
All of the above
None of the above
Question 8
8.
What are the categories of price action?
Up/Down trend, Correction and Retest
Consolidation, Up/Downtrend and Reverse.
Up/Down trend, Consolidation and Retracement.
Breakout, Counter Trend and Reverse.
Question 9
9.
Which is the example of counter trend trading ?
A trader would look for sell opportunities during uptrend and buy opportunities during downtrends.
A price have broken the previous resistance and trader took position at that point and price continue to move up.
The market is taking break from a long run
Price are move in a defined pattern and a highly fundamental news can moves it up/down.
Question 10
10.
What is a Retracement Trade?
A minor pullback
A Retracement are temporary in nature and do not indicate a shift in the large trend.
Both of A and B
A movement of price in between a low and high, and price is staying between a support and resistance.
Question 11
11.
In a period of consolidation we can do a counter trader ?
No there should be a break out needed for counter trade.
Counter trade is a part of reverse trading.
Yes we can, by looking to patterns forming on the chart.
None of the above.
Question 12
12.
What is the best explanation of Reverse Trading
A impulsive down move from resistance, breaking the two support level after the retrancement?
A price have broken the previous resistance and trader took position at that point and price continue to move up.
Market pumped again to its previous support or resistance and then a pullback after retracement.
A and C
Question 13
13.
When market is in up trend, price action makes higher highs and lowest low
True
False
Question 14
14.
There is no difference between retracement and reversal trend as both reverse the trend
True
False
zoom_in
1
Question 15
15.
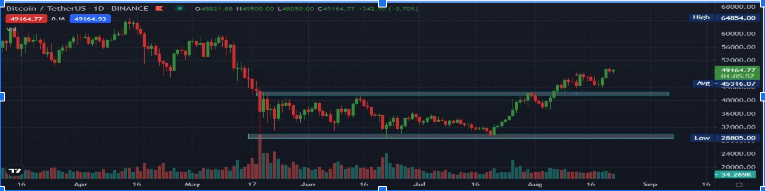
Which price action category fits perfectly to this chart?
Up and down trend
Reversal
Consolidation
D