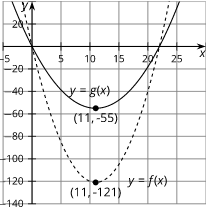
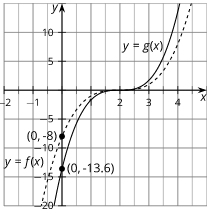
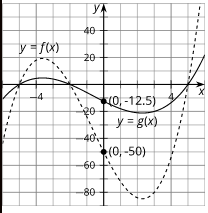
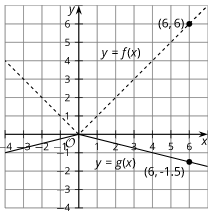
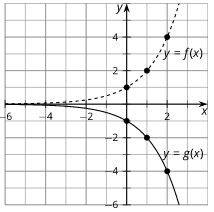
In each pair of graphs shown here, the values of function g are the values of function f multiplied by a scale factor. Express g in terms of f using function notation.

In each pair of graphs shown here, the values of function g are the values of function f multiplied by a scale factor. Express g in terms of f using function notation.

In each pair of graphs shown here, the values of function g are the values of function f multiplied by a scale factor. Express g in terms of f using function notation.

In each pair of graphs shown here, the values of function g are the values of function f multiplied by a scale factor. Express g in terms of f using function notation.


The function f is given by
Do you agree with either of them? Explain your reasoning.
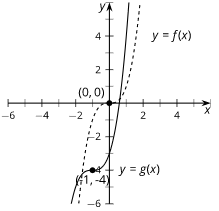
The dashed function is the graph of f and the solid function is the graph of g. Express g in terms of f.
![]()
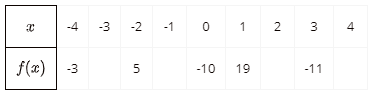
The table shows some values for an odd function f.

Complete the table.
Here is a graph of
![]()
This lesson is from Illustrative Mathematics. Algebra 2, Unit 5, Lesson 8. Internet. Available from https://curriculum.illustrativemathematics.org/HS/teachers/3/5/8/index.html ; accessed 27/July/2021.
IM Algebra 1, Geometry, Algebra 2 is © 2019 Illustrative Mathematics. Licensed under the Creative Commons Attribution 4.0 International License (CC BY 4.0).
The Illustrative Mathematics name and logo are not subject to the Creative Commons license and may not be used without the prior and express written consent of Illustrative Mathematics.
These materials include public domain images or openly licensed images that are copyrighted by their respective owners. Openly licensed images remain under the terms of their respective licenses. See the image attribution section for more information.