8.6 Natural Hazards Pre-Test 21-22 SY
star
star
star
star
star
Posljednje ažuriranje about 4 years ago
20
3
1
3
1
1
3
1
1
2
1
1
1
3
3
1
1
1
3
1
1
ESS3.B: Natural Hazards
Mapping the history of natural hazards in a region, combined with an understanding of related geologic forces can help forecast the locations and likelihoods of future events. (MS-ESS3-2)
ESS2.B: Plate Tectonics and Large-Scale System Interactions
Plate tectonics is the unifying theory that explains the past and current movements of the rocks at Earth’s surface.
Science and Engineering Practices:
Analyzing and Interpreting Data
Analyze and interpret data to determine similarities and differences in findings.
Constructing Explanations
Construct an explanation that includes qualitative relationships between variables that predict(s) phenomena.
Cross-cutting Concepts:
Patterns
Graphs, charts, and images can be used to identify patterns in data.
Stability and Change
Stability might be disturbed either by sudden events or gradual changes that accumulate over time.
PS4-3 Influence of Science, Engineering, and Technology on Society and the Natural World
The uses of technologies and any limitations on their use are driven by individual or societal needs, desires, and values.
Many different technologies can be used to forecast or reduce the negative impacts of natural hazards. Choose ONE technology from the list below, and describe how it is used to forecast or reduce the effects of a natural hazard.
Technologies: (Choose one)
Seismic resistant construction
Levees/Dams
Weather balloons
Satellites/drones
Cone of uncertainty
In complete sentences, how is your chosen technology used to forecast or reduce the impacts of a natural hazard?
Use this map to help you answer questions 2 - 7.
The map below shows the Huron River as it passes through Ann Arbor, MI.
Three houses (A, B, and C) are labeled on the map.
Within the 100-year flood zone, a flood occurs on average once in a 100-year period.
Within the 500-year flood zone, a flood occurs on average once in a 500-year period.

Examine the map for patterns in the location of the 100-year and 500-year flood zone. In general, which flood zone is a lower elevation?
Considering your answer for #2 above, why would flooding be more likely to occur in this location?
Choose the 3 BEST pieces of evidence from the list below.
Which house on the map has the greatest flood risk?
Which house on the map has the least flood risk?
Explain how you used evidence from the map to choose your flood risk rankings for the houses in questions 4 and 5 above. Be sure to talk about all three homes, the 100-year flood zone, and the 500-year flood zone.
Which event would NOT be a precursor to THIS flooding event, which took place in Michigan?
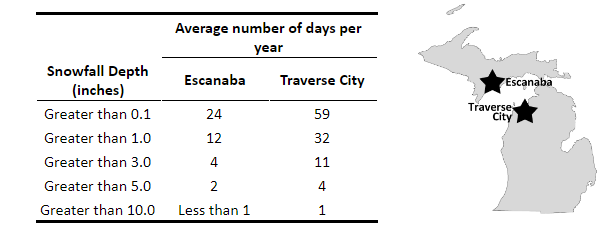
Use this data table and map to answer questions 8 - 11.
For the past 30 years, the National Oceanic and Atmospheric Administration has collected storm data from around the country. The table below shows the average number of days per year that two Michigan cities received various amounts of snowfall. Escanaba is located in the southern Upper Peninsula, while Traverse City is located in the northern Lower Peninsula. Both are on the shore of Lake Michigan.
From this data, forecast the city for which snowfall is likely to be a more common natural hazard.
Support your forecast with evidence from the data and/or map. Choose the 2 BEST pieces of evidence from the list below.
Based on the data given, what snowfall depth occurs most frequently in these cities?
Based on the data given, what snowfall depth occurs least frequently in these cities?
Just before a severe hurricane occurs, many of the people that live in the affected area prepare by evacuating the area or adding protection to their homes. However, just before a severe earthquake occurs, people generally do not prepare.
Use your knowledge of these natural hazards and how they are forecast - think about why people prepare differently for hurricanes than earthquakes. Choose which reason below does NOT apply.
Earthquakes are natural hazards which occur in the area around Mount Everest.
Use information from the map below and your knowledge of earthquakes to support your description.
Choose the 3 BEST pieces of evidence from the list below.

Which THREE natural hazards are NOT directly caused by movement of tectonic plates?
Use this map as a reference as you answer questions 15 - 18.

In which part of the United States would you experience a risk of landslides?
In what part of the United States would you experience a greater risk of negative impacts from hurricanes?
If you were concerned about having your house destroyed by a volcanic eruption, which state should you AVOID living in?
In Michigan, which three natural hazards are most likely to have a negative impact on people and property?
Choose the best strategy for migitating the impacts of a tsunami.
Choose the best strategy for migitating the impacts of a wildfire.