1
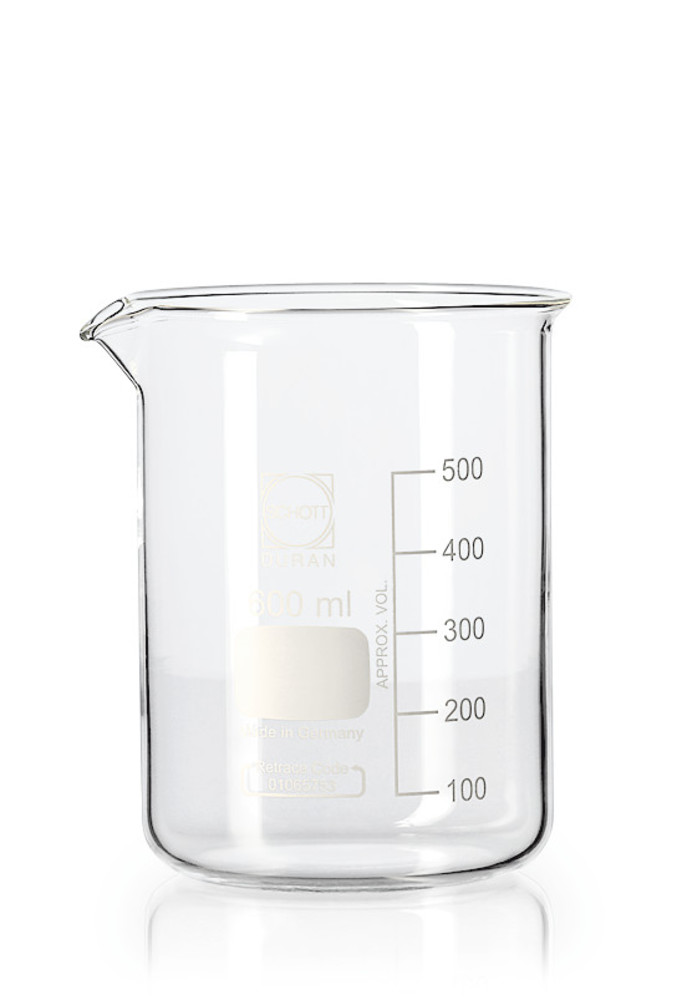
Name this piece of apparatus
Name this piece of apparatus
what apparatus is used to measure the volumes of liquids
Name this piece of apparatus
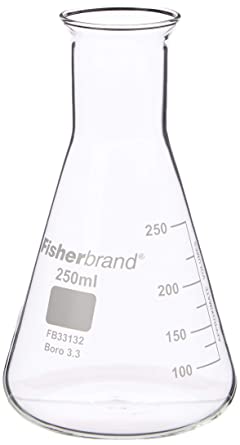
Name this piece of apparatus
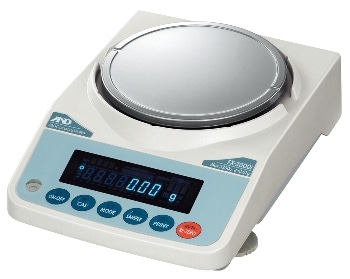
Choose the name of this apparatus
Choose the correct pieces of apparatus I would need to set up in order to heat up a beaker of water

What is missing from this method?

What is missing from this method?

What is missing from this method?
Choose the correct pieces of apparatus I would need to set up in order to heat up a beaker of water
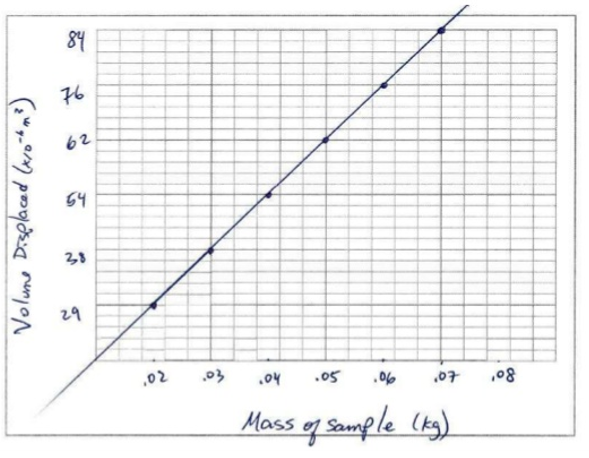
What is wrong with this graph?
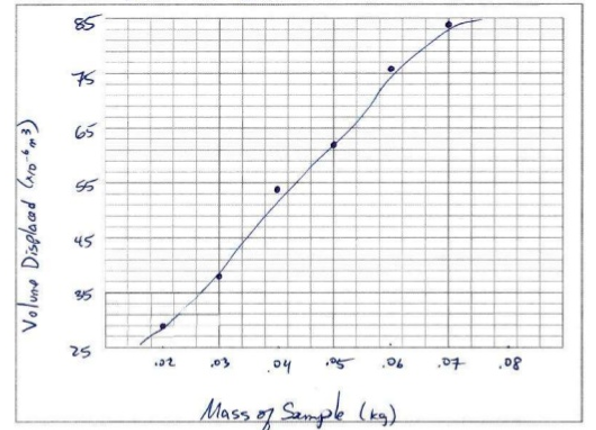
What is wrong with this graph?
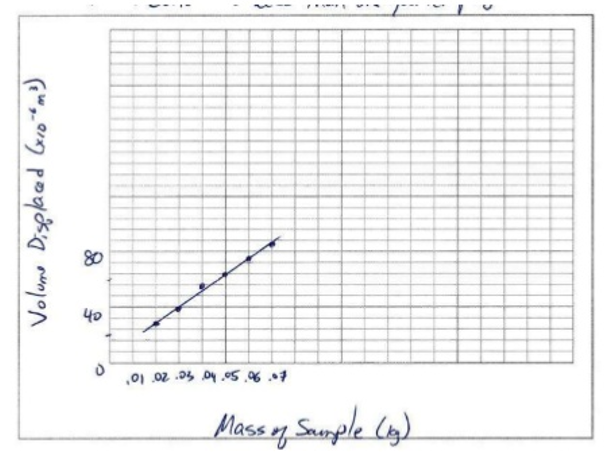
What is wrong with this graph?
What is wrong with this graph