7.2.11
star
star
star
star
star
Posljednje ažuriranje about 2 years ago
9
2
1
1
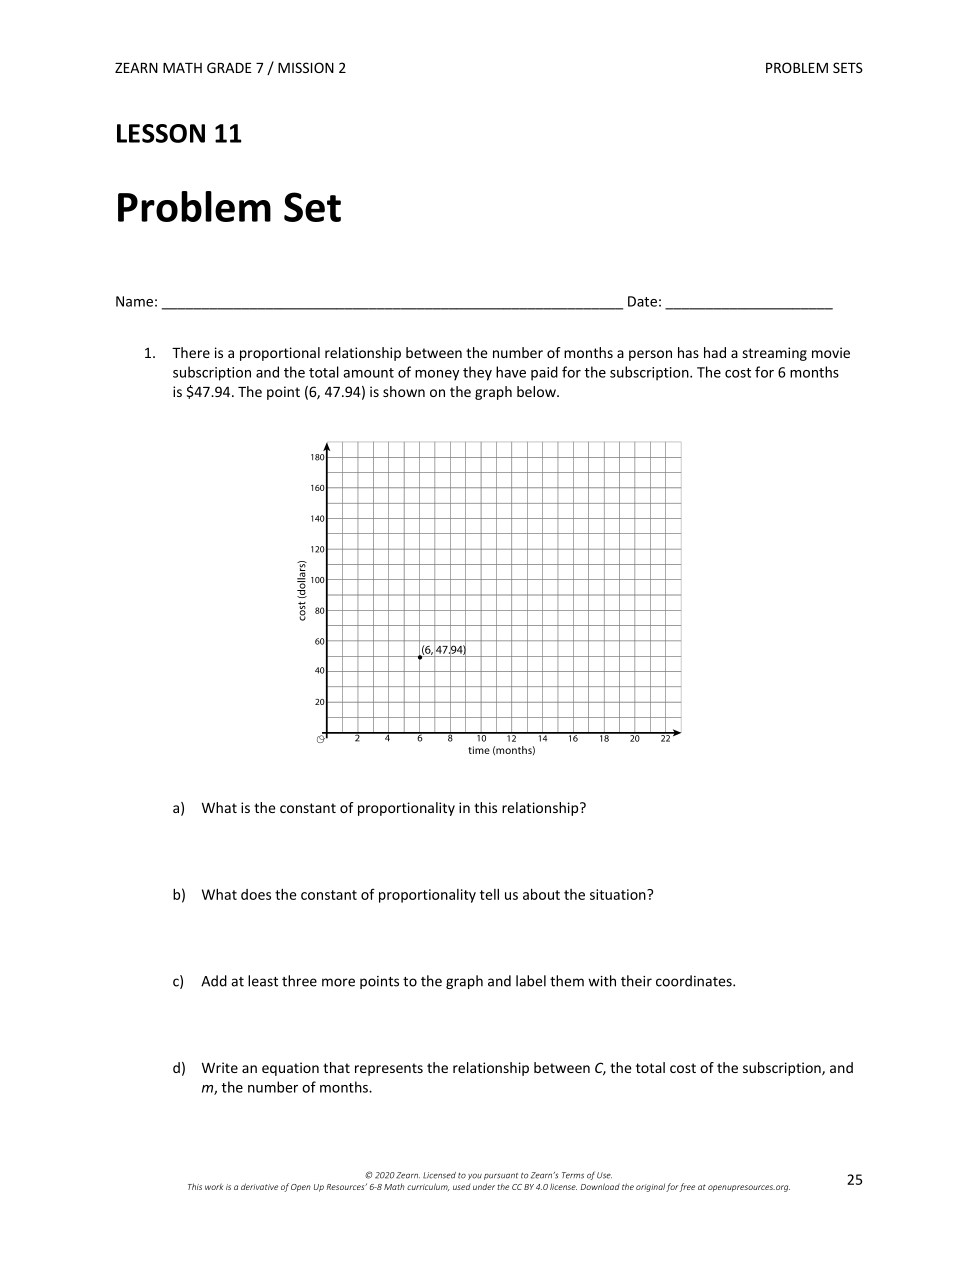
1a. What is the constant of proportionality in this relationship?
1b. What does the constant of proportionality tell us about the situation?
1c. Add at least three more points to the graph and label them with their coordinates.
1d. Write an equation that represents the relationship between C, the total cost of the subscription, and m, the number of months.
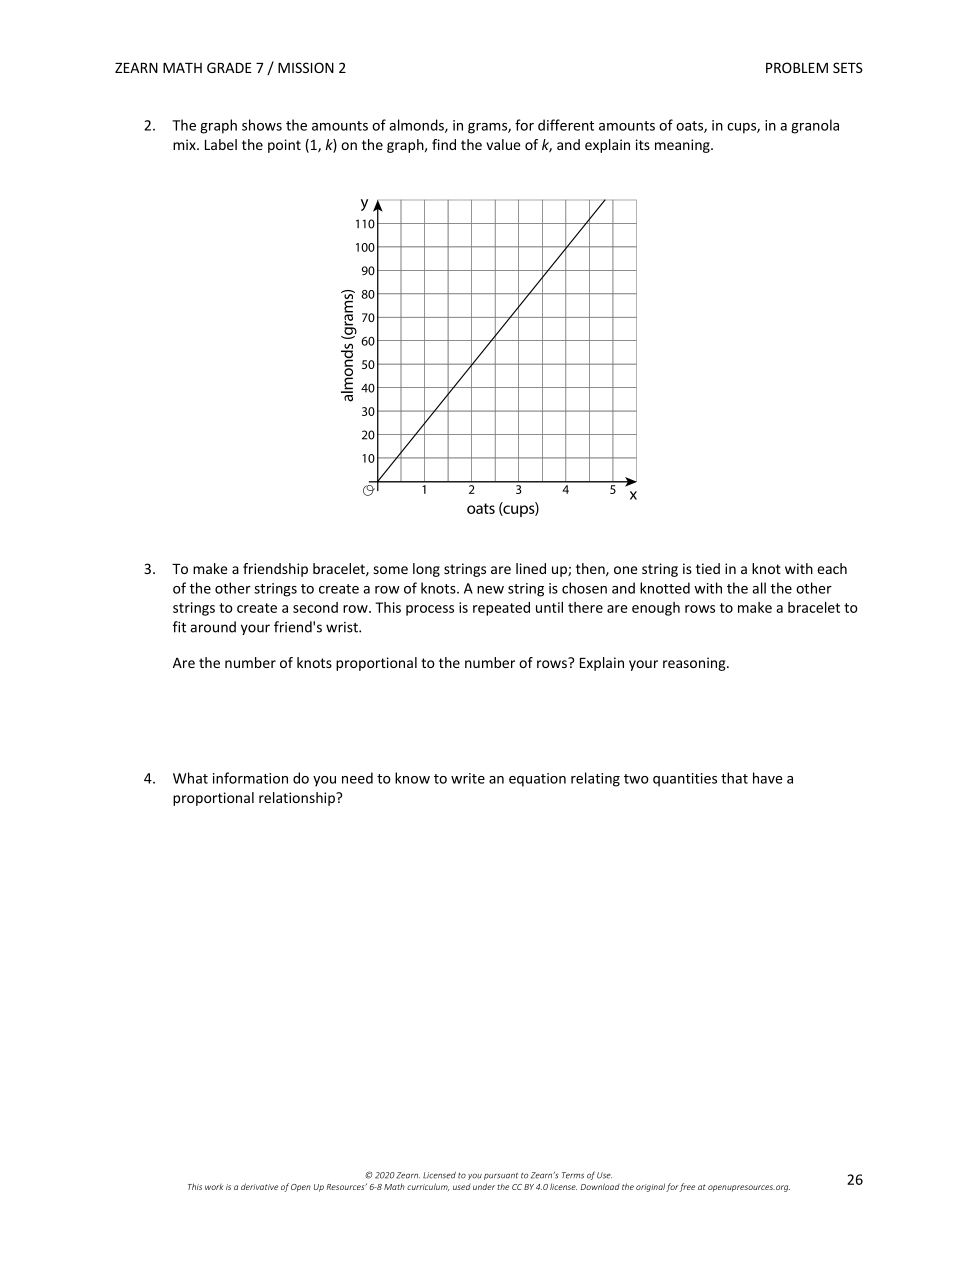
2. The graph shows the amounts of almonds, in grams, for different amounts of oats, in cups, in a granola mix. Label the point (1, k) on the graph and find the value of k.
Type the value for k in the box below.
3. Are the number of knots proportional to the number of rows?
Select all the information that you need to write an equation relating two quantities that have a proportional relationship.
EXIT TICKET
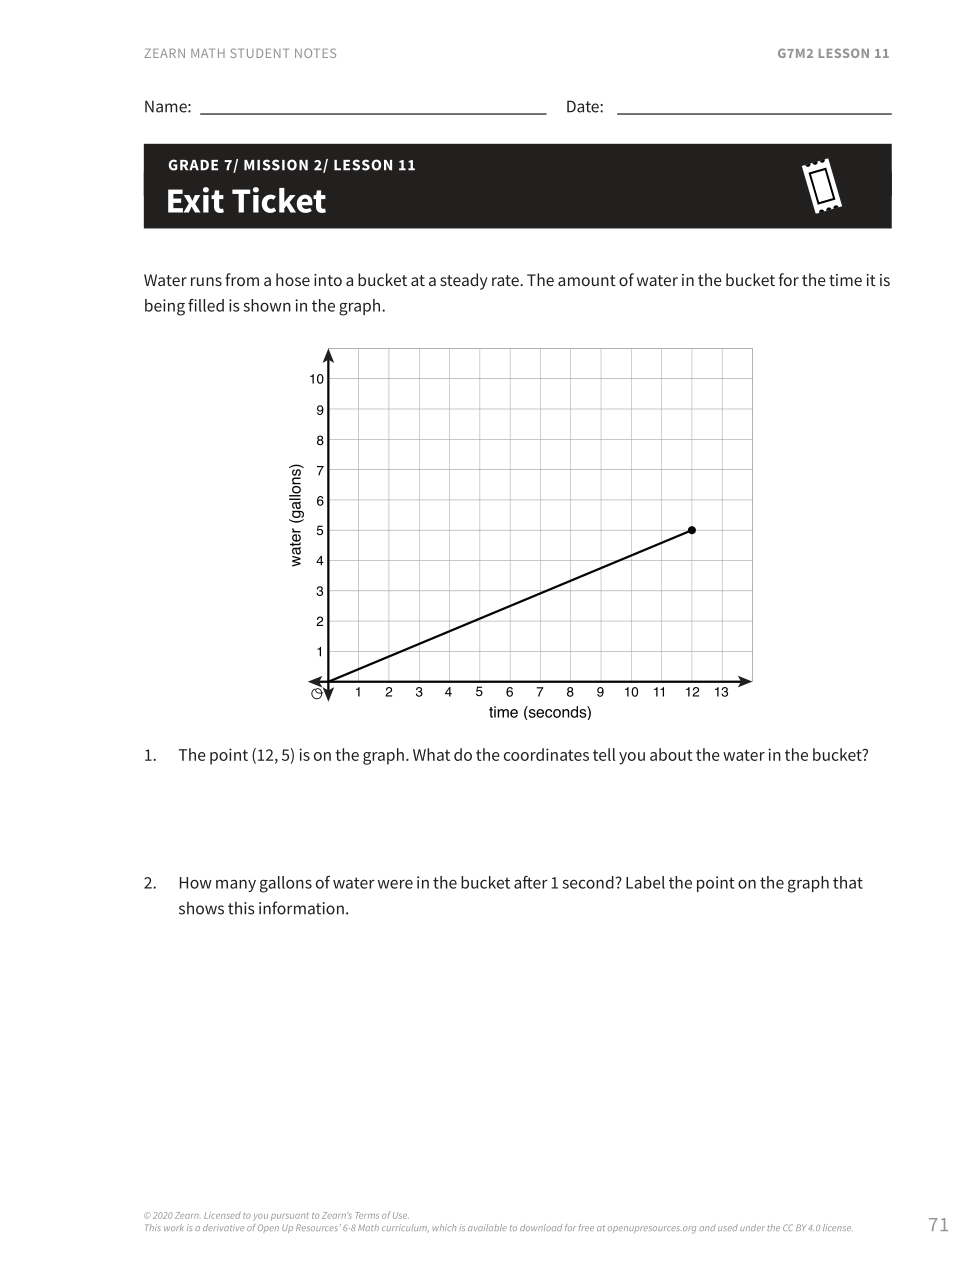
1. The point (12, 5) is on the graph. What do the coordinates tell you about the water in the bucket?
Exit Ticket
2. How many gallons of water were in the bucket after 1 second?
Label the point on the graph that shows this information.