7.2.12
star
star
star
star
star
Posljednje ažuriranje about 2 years ago
17
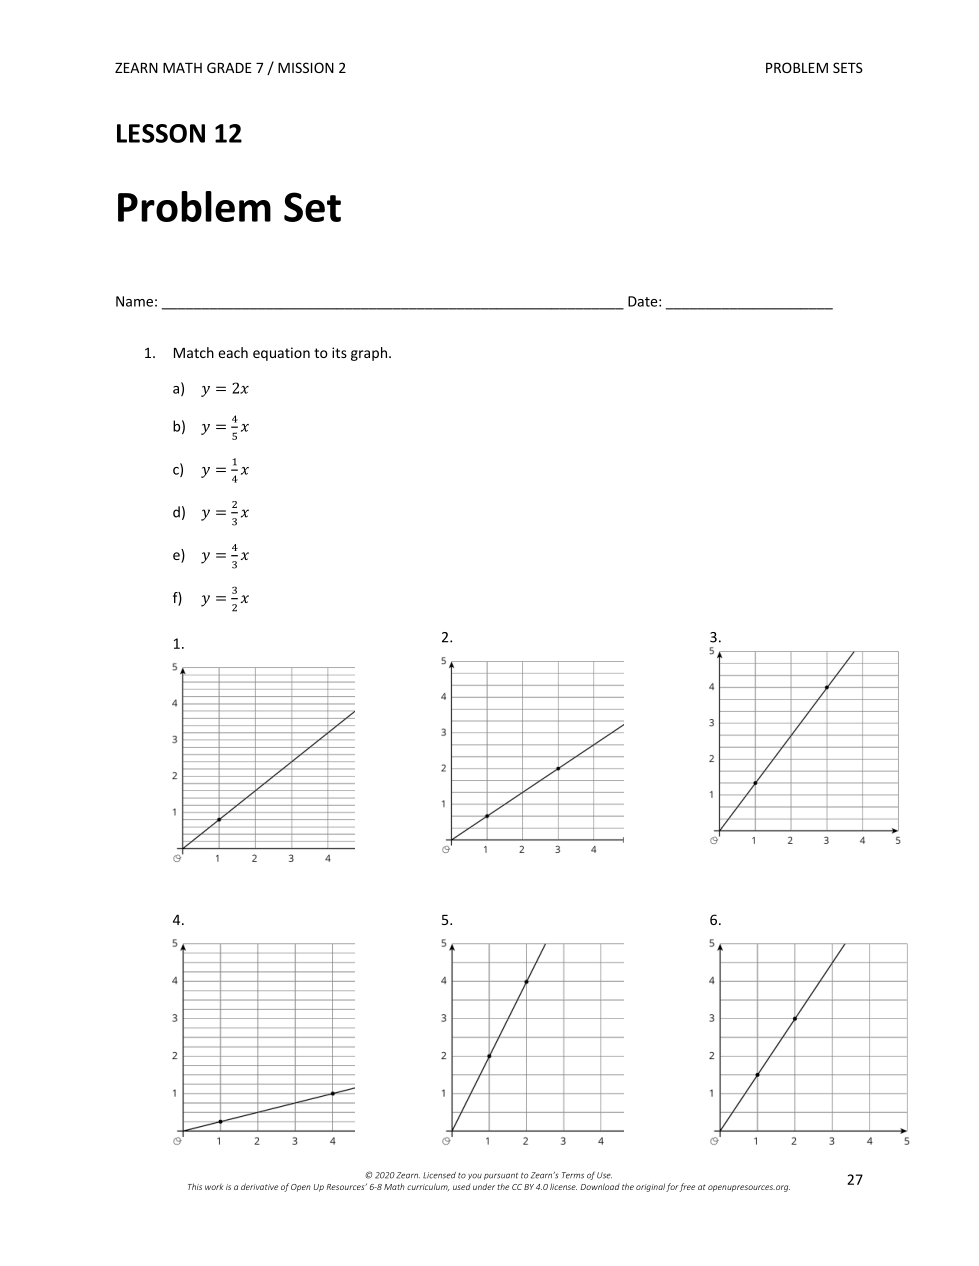
1
1
1
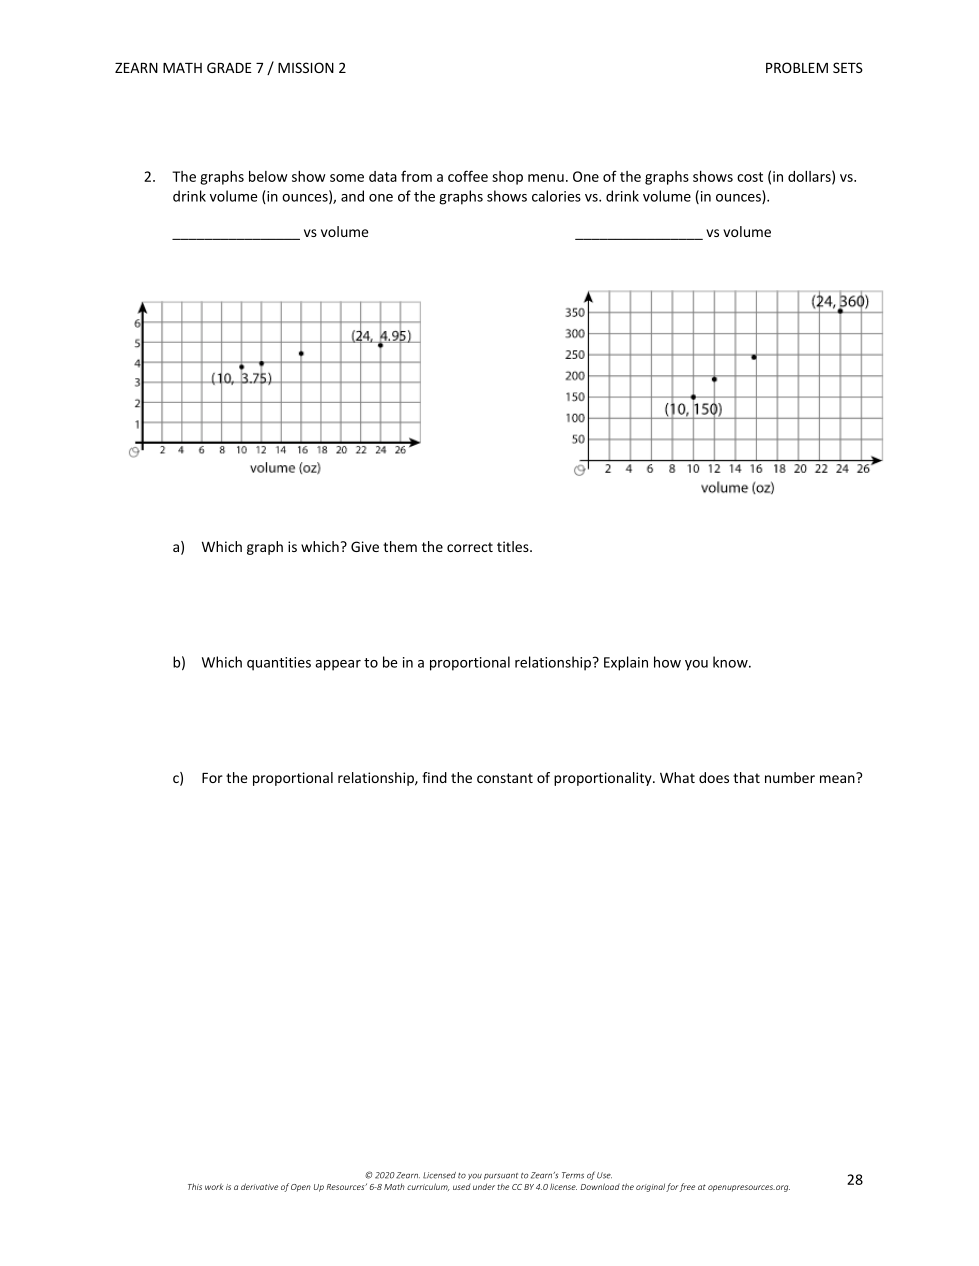
2a. Which graph is which? Give them the correct titles?
2b. Which quantities appear to be in a proportional relationship?
3a. Draw a graph with two lines that represent the bike rides of Lin and Andre.
1 point for Lin's line
1 point for Andre's line
b) For each line, LABEL the point with coordinates (1, k) and find k.
2 points
3b. For Lin's graph
k=
3b. For Andre's graph
k=
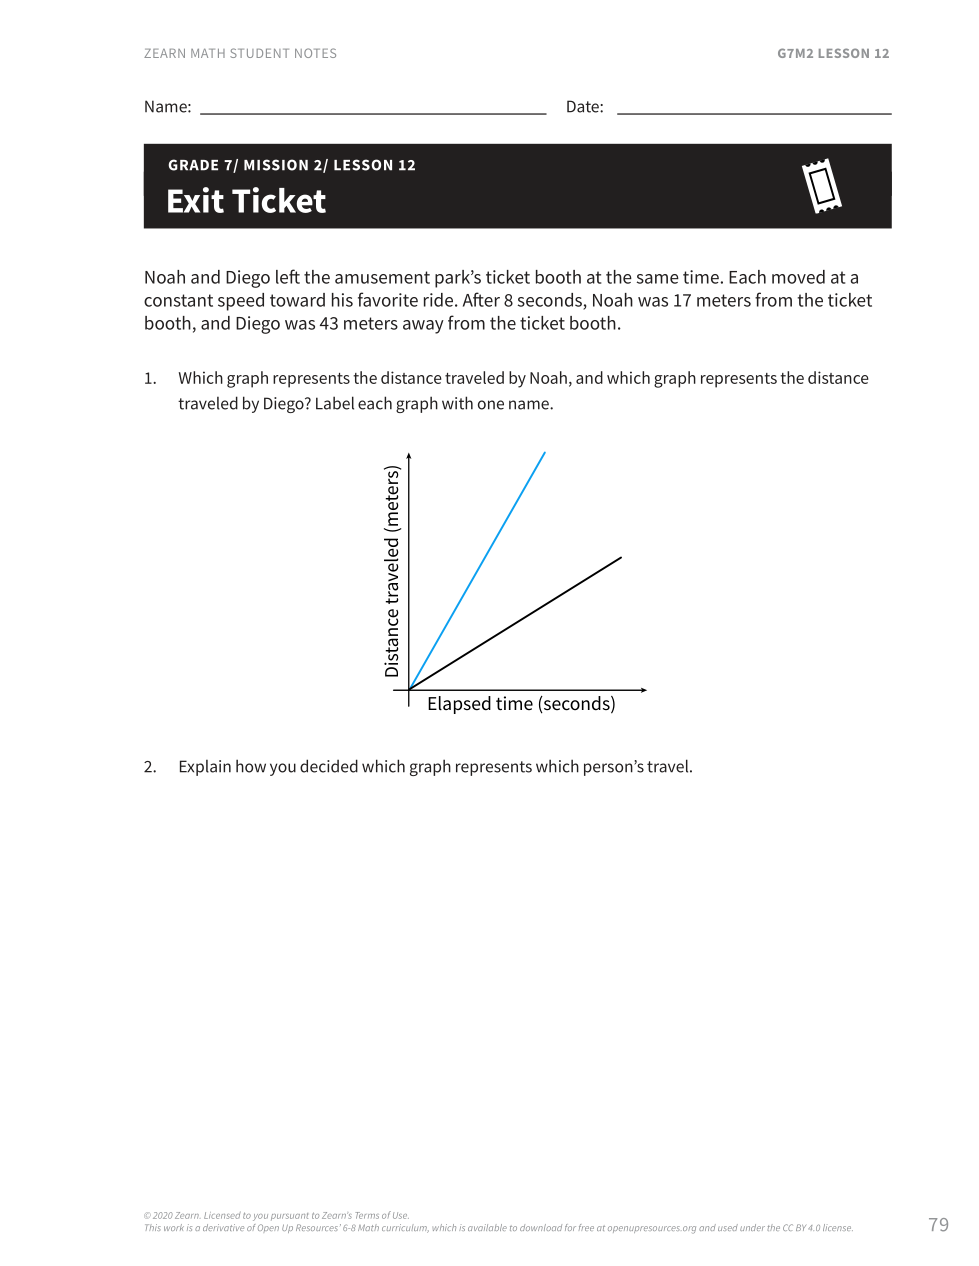
EXIT TICKET
1. The BLUE graph represents:
EXIT TICKET
1. The BLACK graph represents:
Exit Ticket
2. Explain how you decided which graph represents which person's travel.
2c. For the proportional relationship that you chose above, find the constant of proportionality.
2c. What does the number you found above (constant of proportionality) mean?
3c. Who was biking faster?