7.2.13
star
star
star
star
star
Posljednje ažuriranje about 2 years ago
13
2
2
4
1. At the supermarket you can fill your own honey bear container. A customer buys 12 oz of honey for $5.40.
a. How much does honey cost per ounce?
1b. How much honey can you buy per dollar?
3. A trail mix recipe asks for 4 cups of raisins for every 6 cups of peanuts. There is a proportional relationship between the amount of raisins, r (cups),and the amount of peanuts p (cups), in this recipe.
a. Write the equation for the relationship that has a constant of proportionality GREATER than 1. (1 pt)
Show your work: Graph the relationship. Remember to label your x and y axes. (1 pt)
3. A trail mix recipe asks for 4 cups of raisins for every 6 cups of peanuts. There is a proportional relationship between the amount of raisins, r (cups),and the amount of peanuts p (cups), in this recipe.
b. Write the equation for the relationship that has a constant of proportionality LESS than 1. (1 pt)
Show your work: Graph the relationship. Remember to label your x and y axes. (1 pt)
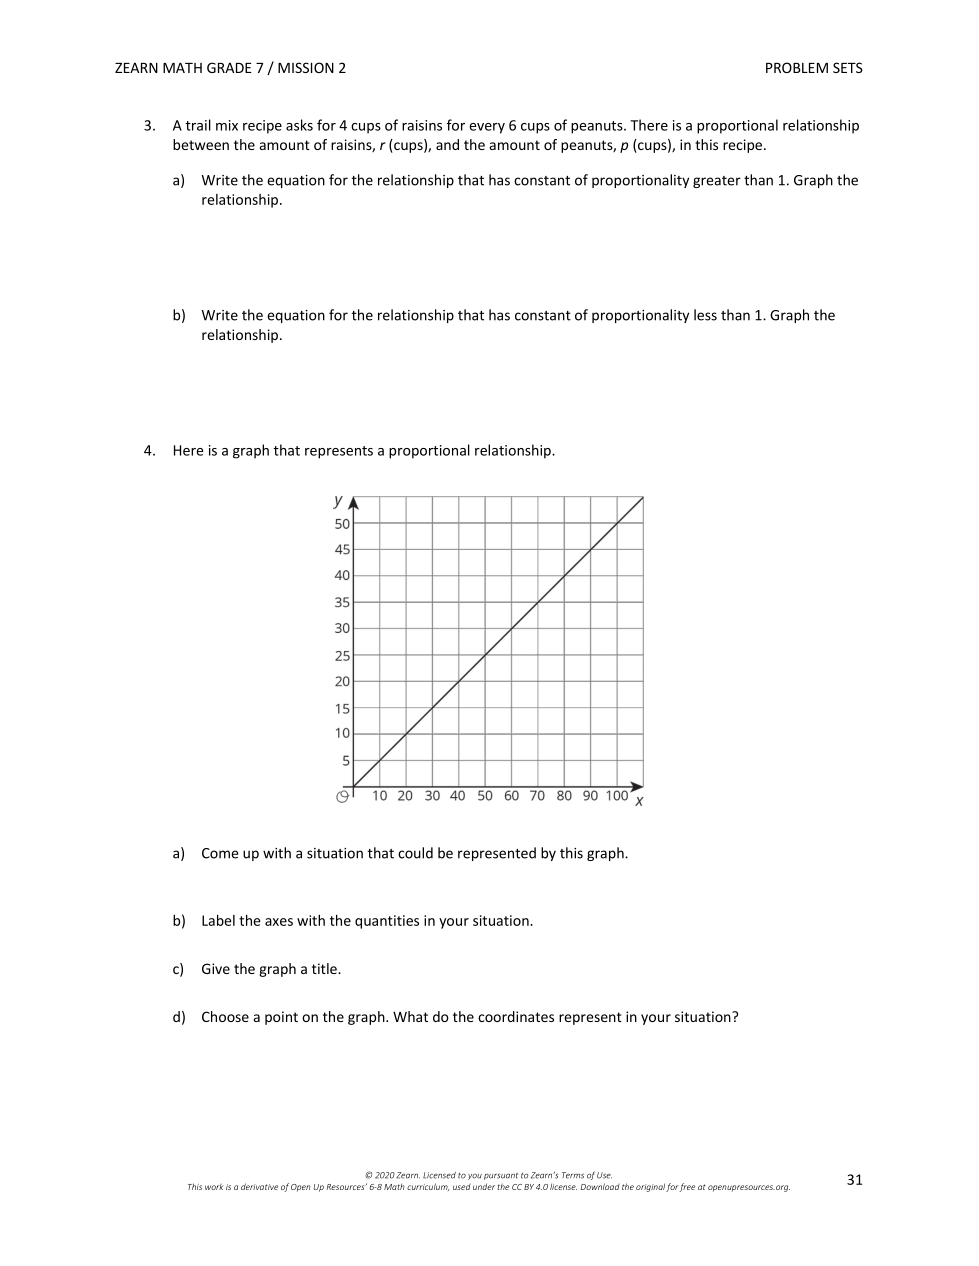
4. Here is a graph that represents a proportional relationship.
a) Come up with a situation that could be represented by this graph.
b) Label the axes with quantities in your situation. (2pts)
c. Give the graph a title. (1pt)
d. Choose a point on the graph. What do the coordinates represent in your situation? Use a text box to write a sentence. (1pt)
EXIT TICKET
Elena went to a store where you can scoop your own popcorn and buy as much as you want. She bought 10 ounces of spicy popcorn for $2.50. The amount of popcorn you get and money you have to pay for the popcorn are in a proportional relationship.
1. How much does popcorn cost per ounce?
Exit Ticket
2. How much popcorn can you buy per dollar?
Exit Ticket
3. Write two different equations that represent this situation.
Use p for ounces of popcorn and c for cost in dollars.
Write this equation as p=
Exit Ticket
3. Write two different equations that represent this situation.
Use p for ounces of popcorn and c for cost in dollars.
Write this equation as c=
1c. Choose two equations that correctly represent this situation.
Use h for ounces of honey an c for cost in dollars.
1d. Choose one of the correct equations from above and sketch its graph.
Be sure the label the axes.
2. The point (3, 6/5) LIes on the graph representing a proportional relationship. Which of the following points also lie on the same graph?
Select ALL that apply.
Exit Ticket
4. Choose one of your equations, and sketch its graph.
Be sure to label the axes.