Grade 7 End of Mission 2 Assessment
star
star
star
star
star
Posljednje ažuriranje about 2 years ago
10
1
1
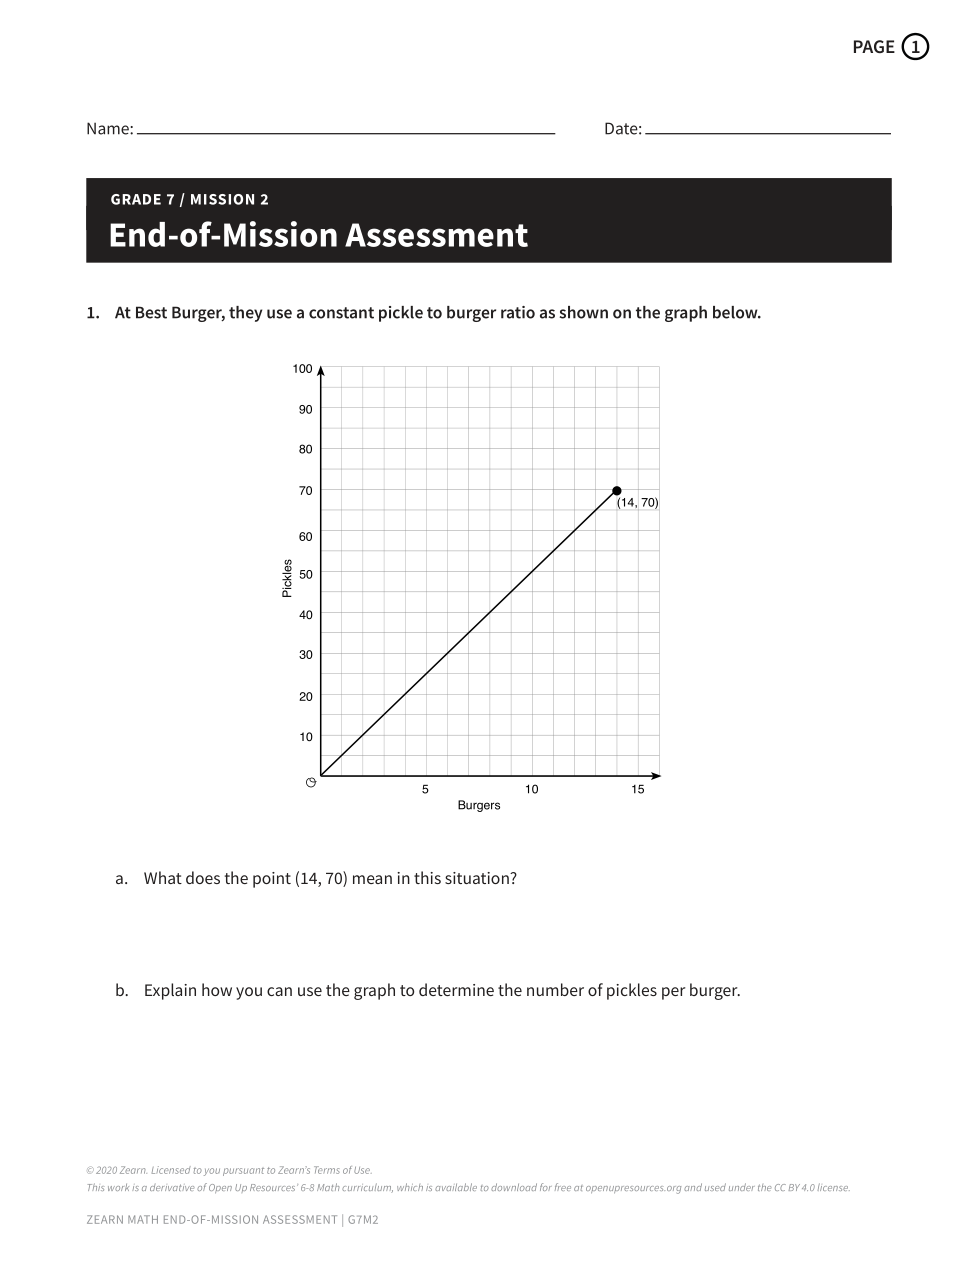
1b. Explain how you can use the graph to determine the number of pickles per burger.
Hint: Tell me how many pickles per burger.
1b. Explain how you can use the graph to determine the number of pickles per burger.
Hint: Tell me how many pickles per burger.