7.2.10
star
star
star
star
star
Last updated about 2 years ago
11 Nsɛmmisa
2
iii. Is there a proportional relationship between x and y?
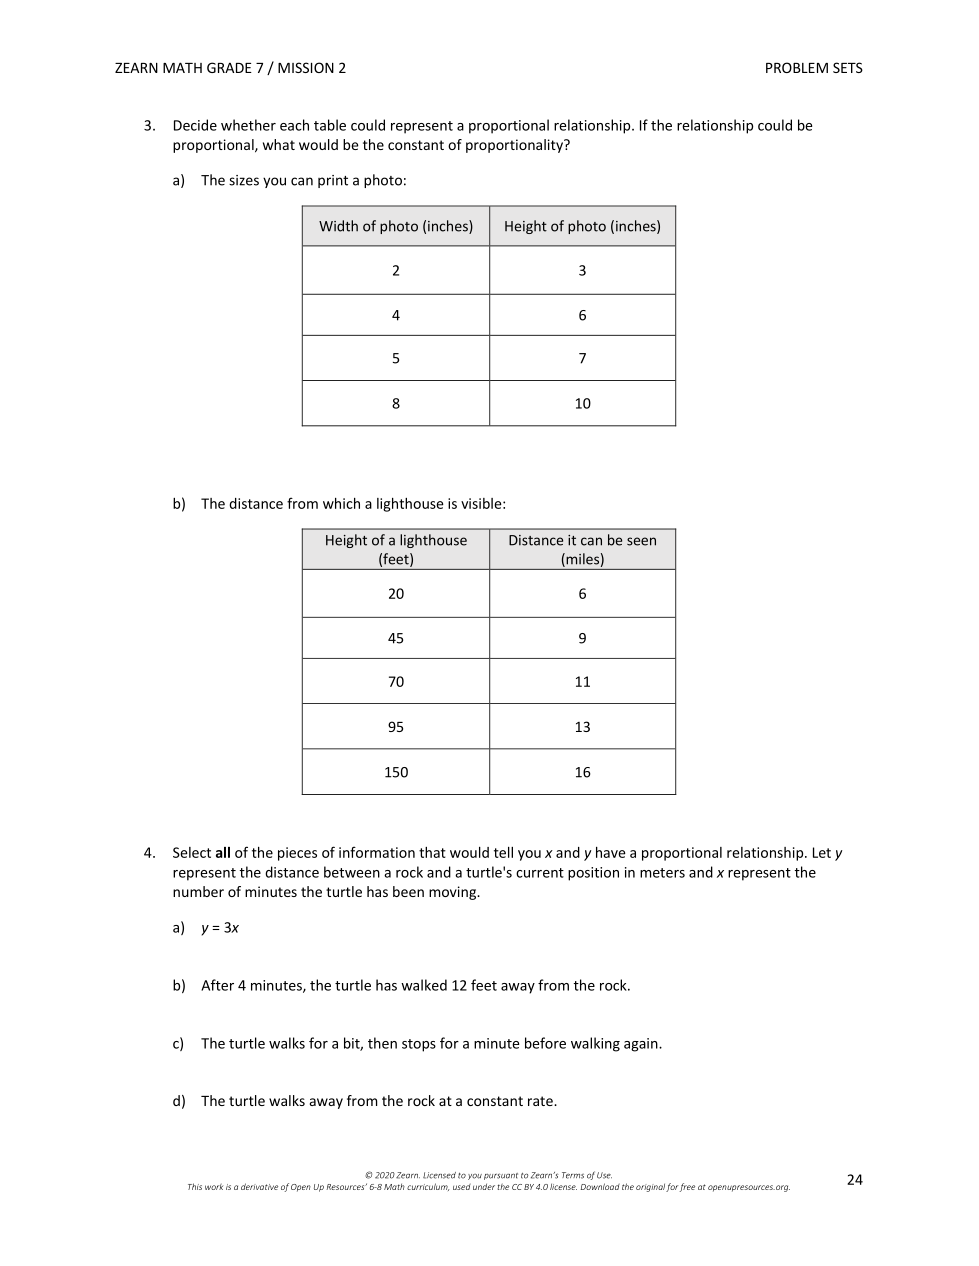
3. Decide whether each table could represent a proportional relationship.
a) The sizes you can print a photo:
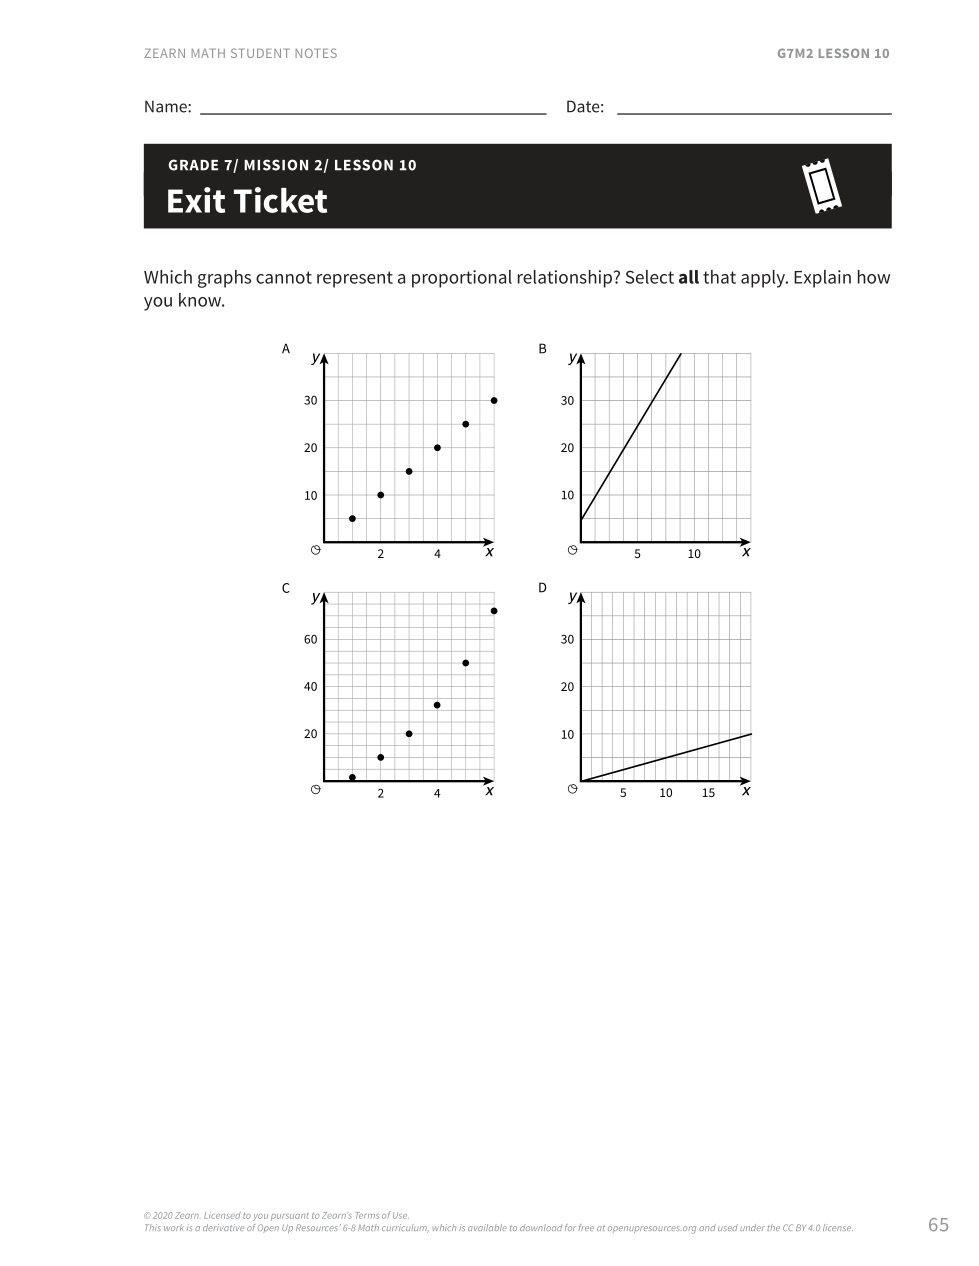
Exit Ticket
Which graphs cannot represent a proportional relationship?
Select all that are NOT PROPORTIONAL!
Explain how you know in the space provided.
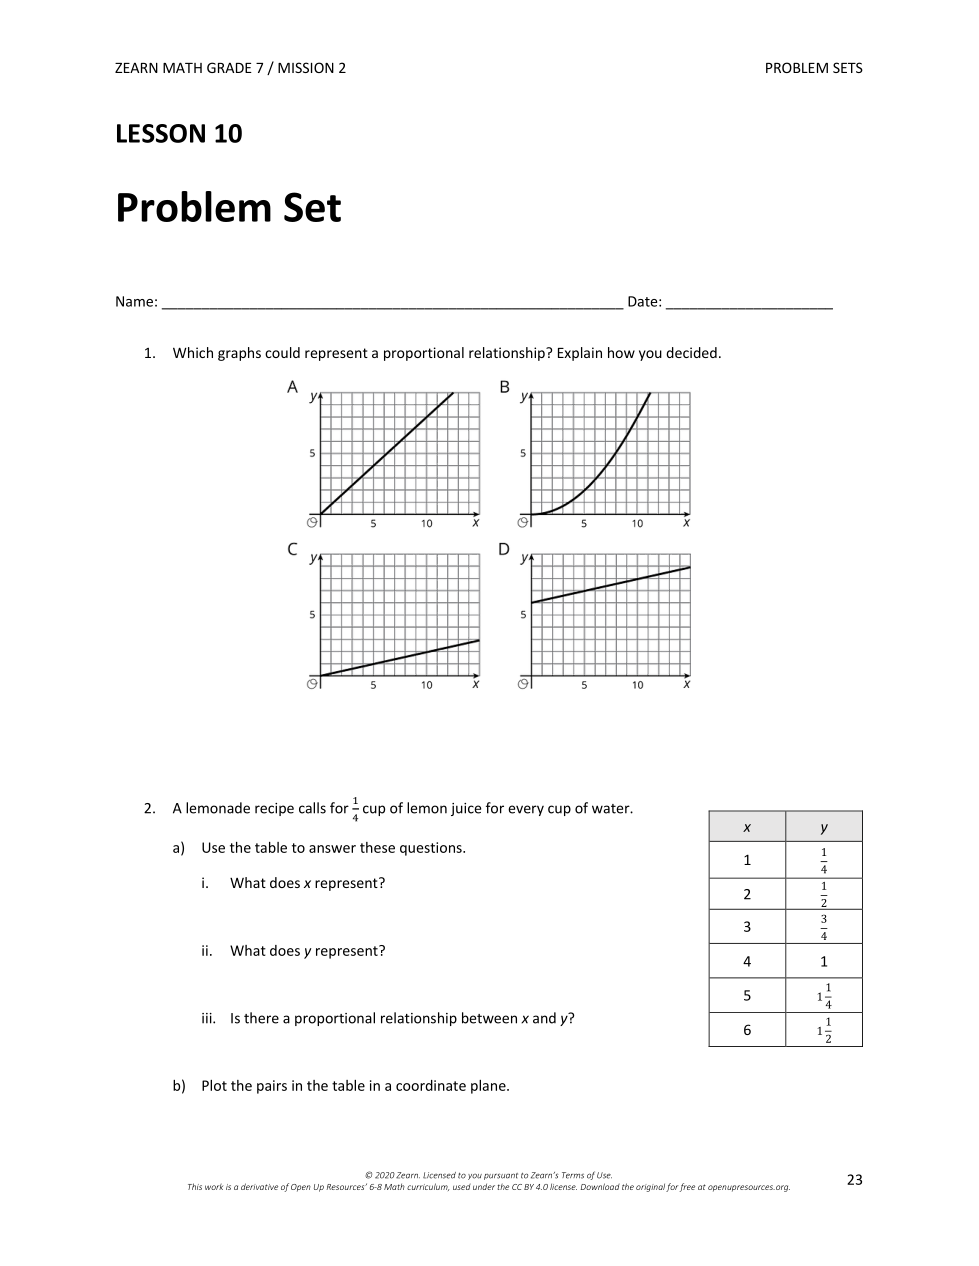
1. Which graphs could represent a proportional relationship.
Explain how you decided in the "show your work" section below.
2. A lemonade recipe calls for 1/4 cup of lemon juice for every cup of water.
a) Use the table to answer these questions.
i. What does x represent?
2. A lemonade recipe calls for 1/4 cup of lemon juice for every cup of water.
a) Use the table to answer these questions.
ii. What does y represent?
2b. Plot the pairs in the table in a coordinate plane.
3a. The sizes you can print a photo.
If the relationship is proportional, what is the constant of proportionality?
*If not proportional, type NA.
3. Decide whether each table could represent a proportional relationship.
b) The distance from which a lighthouse is visible.
3b. The distance from which a lighthouse is visible.
If the relationship is proportional, what is the constant of proportionality?
*If not proportional, type NA.
4. Select ALL the pieces of information that would tell you x and y have a proportional relationship. Let y represent the distance between a rock and a turtle's current position in meters and x represent the number of minutes the turtle has been moving.