Twa kɔ nsɛm atitiriw so
Log in
Sign up for FREE
arrow_back
Laabri

Lesson 15 - Unit 1 - Algebra 1 - Illustrative Mathematics

star
star
star
star
star
Last updated over 3 years ago
16 Nsɛmmisa
1
S.ID.1
S.ID.2
1
S.ID.1
S.ID.2
1
S.ID.1
S.ID.2
1
S.ID.1
S.ID.2
1
S.ID.1
S.ID.2
1
S.ID.1
S.ID.2
1
S.ID.1
S.ID.2
1
S.ID.1
S.ID.2
1
S.ID.1
S.ID.2
1
S.ID.1
S.ID.2
1
S.ID.1
S.ID.2
1
S.ID.1
S.ID.2
1
S.ID.1
S.ID.2
1
S.ID.1
S.ID.2
1
S.ID.1
S.ID.2
1
S.ID.1
S.ID.2
Asemmisa {{asɛmmisaAhyɛnsode}}
1.

Twenty students participated in a psychology experiment which measured their heart rates in two different situations.

What are the appropriate measures of center and variability to use with the data?
Asemmisa {{asɛmmisaAhyɛnsode}}
2.

Twenty students participated in a psychology experiment which measured their heart rates in two different situations.

Which situation shows a greater typical heart rate?

Asemmisa {{asɛmmisaAhyɛnsode}}
3.

Twenty students participated in a psychology experiment which measured their heart rates in two different situations.

Which situation shows greater variability?

Asemmisa {{asɛmmisaAhyɛnsode}}
4.

Invent two situations that you think would result in distributions with similar measures of variability. Explain your reasoning.

Asemmisa {{asɛmmisaAhyɛnsode}}
5.

Invent two situations that you think would result in distributions with different measures of variability. Explain your reasoning.

Asemmisa {{asɛmmisaAhyɛnsode}}
6.

The data set and some summary statistics are listed.

11.5, 12.3, 13.5, 15.6, 16.7, 17.2, 18.4, 19, 19.5, 21.5

  • mean: 16.52

  • median: 16.95

  • standard deviation: 3.11

  • IQR: 5.5

How does adding 5 to each of the values in the data set impact the shape of the distribution?

Asemmisa {{asɛmmisaAhyɛnsode}}
7.

The data set and some summary statistics are listed.

11.5, 12.3, 13.5, 15.6, 16.7, 17.2, 18.4, 19, 19.5, 21.5

  • mean: 16.52

  • median: 16.95

  • standard deviation: 3.11

  • IQR: 5.5

How does adding 5 to each of the values in the data set impact the measures of center?

Asemmisa {{asɛmmisaAhyɛnsode}}
8.

The data set and some summary statistics are listed.

11.5, 12.3, 13.5, 15.6, 16.7, 17.2, 18.4, 19, 19.5, 21.5

  • mean: 16.52

  • median: 16.95

  • standard deviation: 3.11

  • IQR: 5.5

How does adding 5 to each of the values in the data set impact the measures of variability?

Asemmisa {{asɛmmisaAhyɛnsode}}
9.

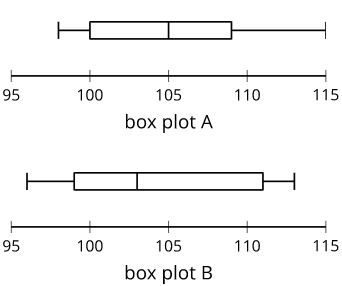
Here are two box plots:

Which box plot has a greater median?

Asemmisa {{asɛmmisaAhyɛnsode}}
10.

Here are two box plots:

Which box plot has a greater measure of variability?

Asemmisa {{asɛmmisaAhyɛnsode}}
11.

Here are two box plots:

Which box plot has a greater median?

Asemmisa {{asɛmmisaAhyɛnsode}}
12.

The depth of two lakes is measured at multiple spots. For the first lake, the mean depth is about 45 feet with a standard deviation of 8 feet. For the second lake, the mean depth is about 60 feet with a standard deviation of 27 feet.

Noah says the second lake is generally deeper than the first lake. Do you agree with Noah?

Asemmisa {{asɛmmisaAhyɛnsode}}
13.

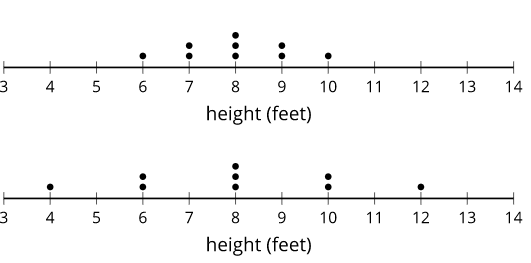
The dot plots display the height, rounded to the nearest foot, of maple trees from two different tree farms.

Compare the mean and standard deviation of the two data sets.

Asemmisa {{asɛmmisaAhyɛnsode}}
14.

The dot plots display the height, rounded to the nearest foot, of maple trees from two different tree farms.

What does the standard deviation tell you about the trees at these farms?

Asemmisa {{asɛmmisaAhyɛnsode}}
15.

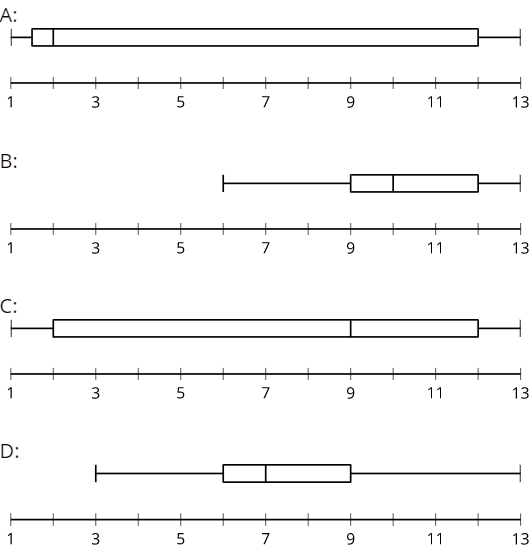
Which box plot has an IQR of 10?

Asemmisa {{asɛmmisaAhyɛnsode}}
16.

What effect does eliminating the lowest value, -6, from the data set have on the mean and median?

-6, 3, 3, 3, 3, 5, 6, 6, 8, 10

This lesson is from Illustrative Mathematics. Algebra 1, Unit 1, Lesson 15. Internet. Available from https://curriculum.illustrativemathematics.org/HS/teachers/1/1/15/index.html ; accessed 26/July/2021.

IM Algebra 1, Geometry, Algebra 2 is © 2019 Illustrative Mathematics. Licensed under the Creative Commons Attribution 4.0 International License (CC BY 4.0).

The Illustrative Mathematics name and logo are not subject to the Creative Commons license and may not be used without the prior and express written consent of Illustrative Mathematics.

These materials include public domain images or openly licensed images that are copyrighted by their respective owners. Openly licensed images remain under the terms of their respective licenses. See the image attribution section for more information.