Log in
Sign up for FREE
arrow_back
Library
Unit 3 Pre-Assessment (Algebra)
By Chris Long
star
star
star
star
star
Share
share
Last updated over 3 years ago
7 questions
Add this activity
1
2
3
4
zoom_in
1
Question 1
1.
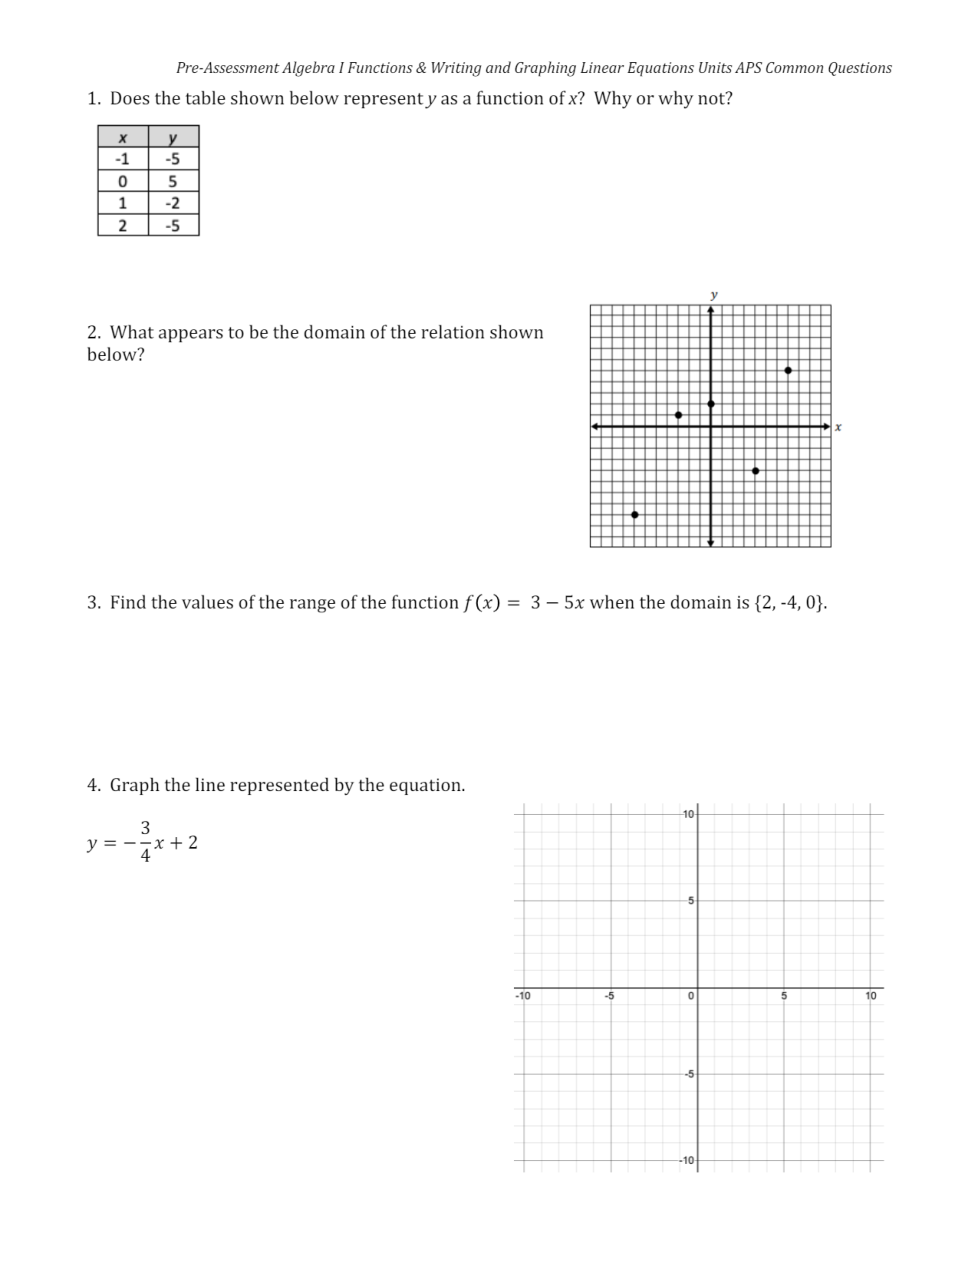
Does the table represent a function? Why or why not?
1
Question 2
2.
What is the Domain of the graph?
1
Question 3
3.
Values of the Range of the function?
visibility
View drawing
1
5
6
7
zoom_in
1
Question 5
5.
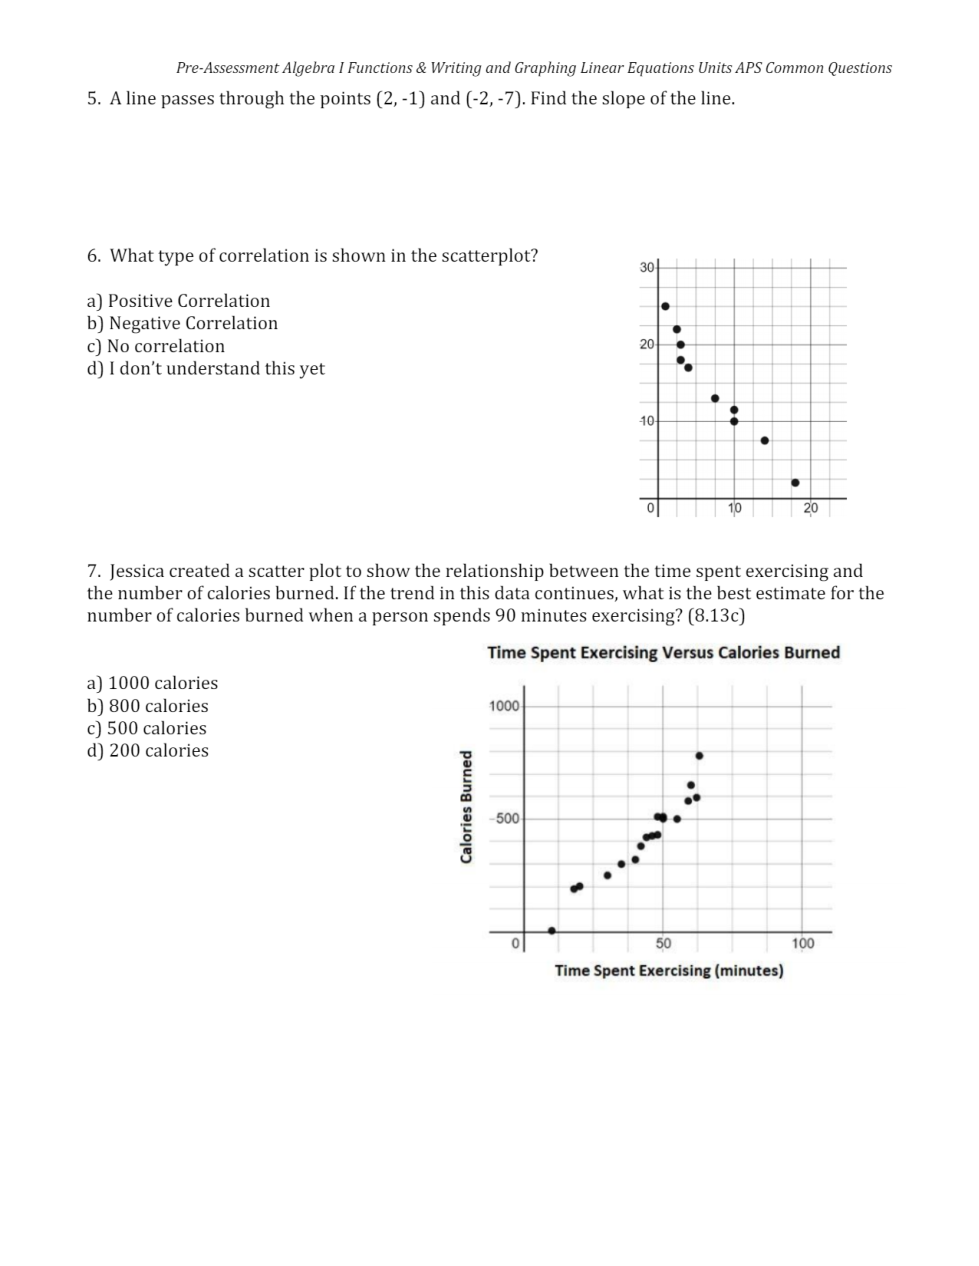
What is the slope of the line that passes through the points given?
1
1
Question 4
4.
Graph the equation
visibility
View drawing
Question 6
6.
What type of correlation is shown in the scatterplot?
A) Positive Correlation
B) Negative Correlation
C) No Correlation
D) I don't understand this yet
Question 7
7.
Based on the graph, what is the number of calories burned when a person spends 90 minutes exercising?
A) 1000 calories
B) 800 calories
C) 500 calories
D) 200 calories
E) I don't understand this yet