Beanium lab
star
star
star
star
star
Posljednje ažuriranje over 4 years ago
16
1
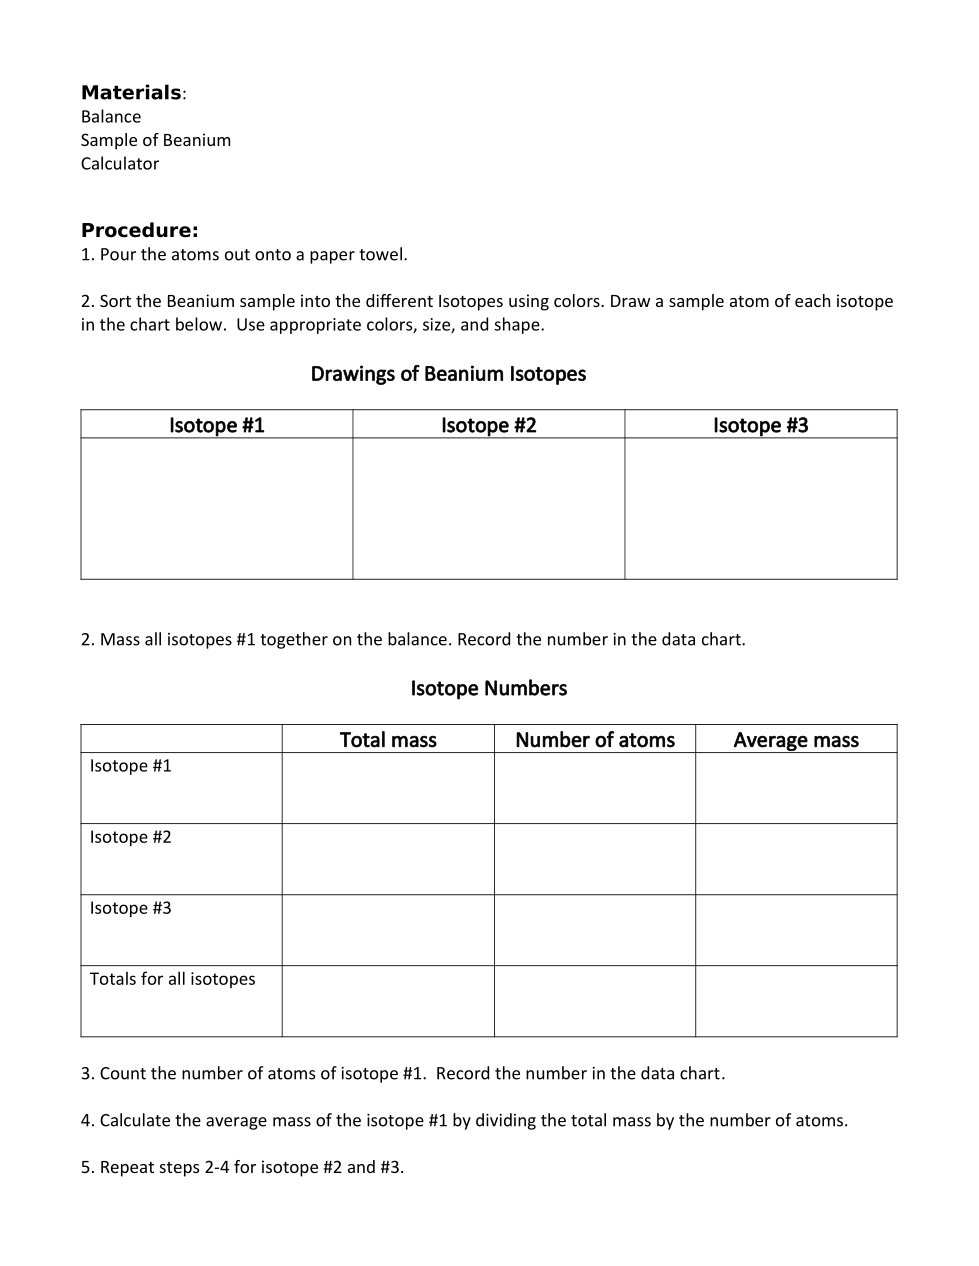
Add an image of your data table (draw it on the paper and then take a photo of it)
Add an image of your data table (draw it on the paper and then take a photo of it)
1
Add an image of your data table (draw it on the paper and then take a photo of it)
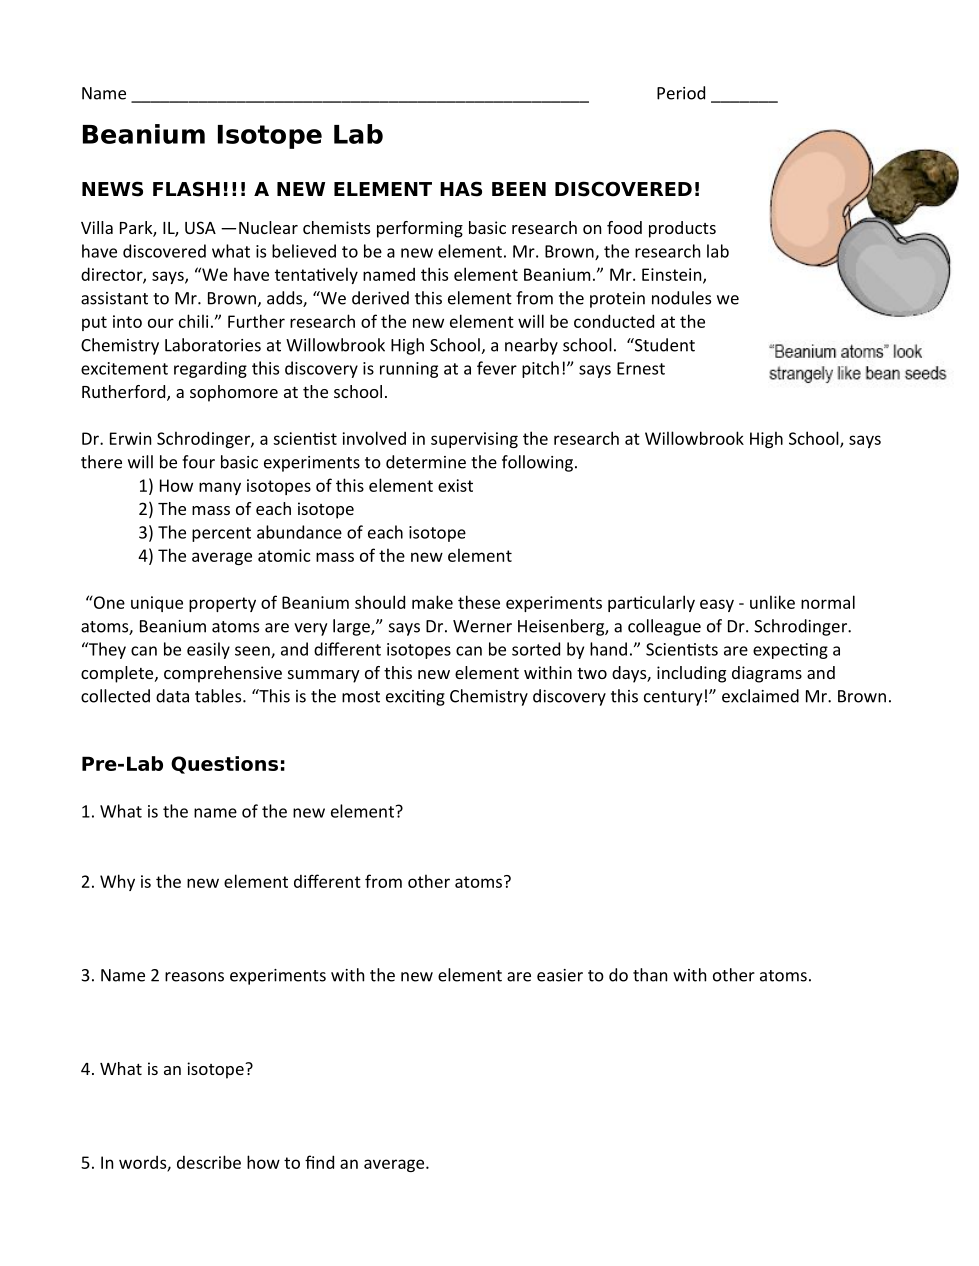
1. What is the name of the new element?
2. Why is the new element different from other atoms?
3. Name 2 reasons experiments with the new element are easier to do than with other atoms.
Add an image of your data table (write it on the paper and then take a photo of it)
4. What is an isotope?
5. In words, describe how to find an average.
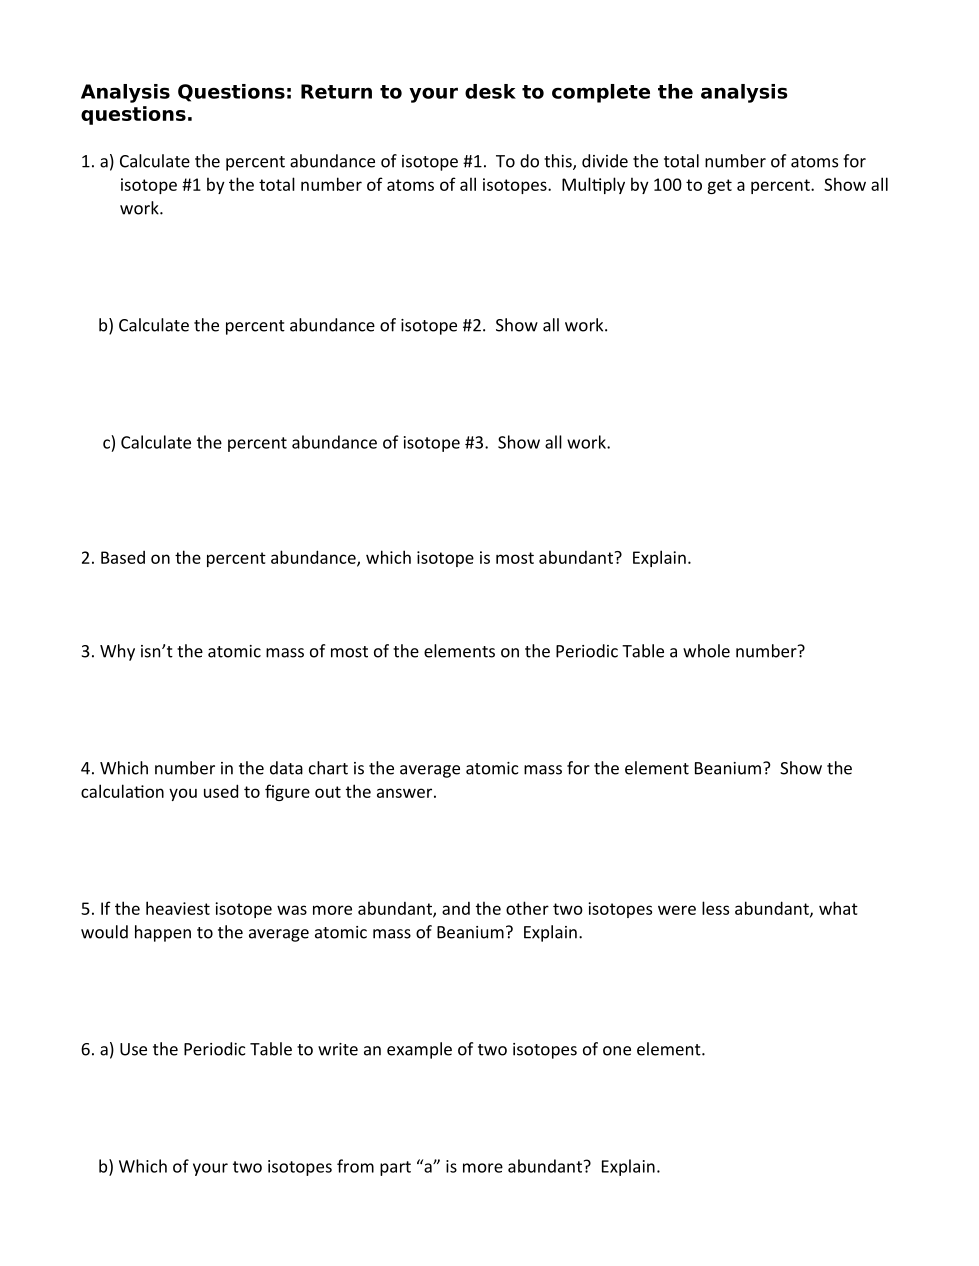
Calculate the percent abundance of isotope #1. To do this, divide the total number of atoms for
isotope #1 by the total number of atoms of all isotopes. Multiply by 100 to get a percent. Show all
work.
Calculate the percent abundance of isotope #2. Show all work.
Calculate the percent abundance of isotope #3. Show all work.
Based on the percent abundance, which isotope is most abundant? Explain.
Why isn’t the atomic mass of most of the elements on the Periodic Table a whole number?
Which number in the data chart is the average atomic mass for the element Beanium? Show the calculation you used to figure out the answer.
If the heaviest isotope was more abundant, and the other two isotopes were less abundant, what would happen to the average atomic mass of Beanium? Explain.
Use the Periodic Table to write an example of two isotopes of one element.
Which of your two isotopes from question 15 is more abundant? Explain.