1
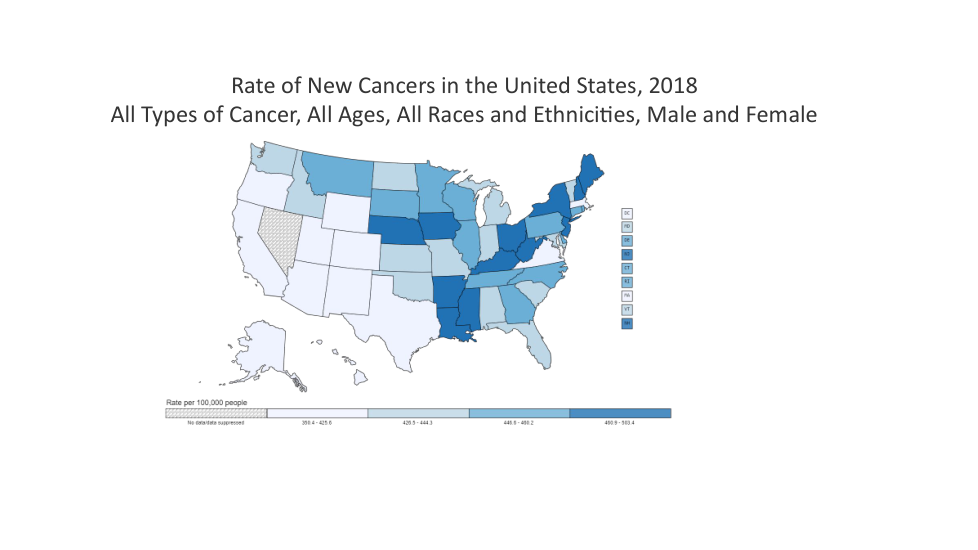
Name a state where Cancer is more common.
Name a state where Cancer is more common.
1
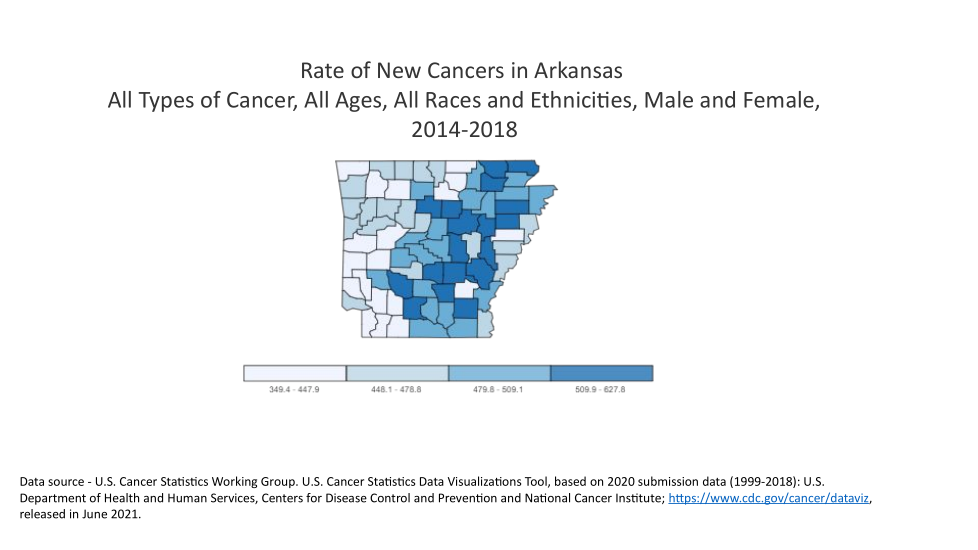
Study the map. Why do you think cancer is more common in some areas? Give examples of why.
Study the map. Why do you think cancer is more common in some areas? Give examples of why.