Quantifying Biodiversity Lab
star
star
star
star
star
Last updated almost 4 years ago
9 Nsɛmmisa
1
One of the challenges confronting biologists who study biodiversity is how to measure and quantify diversity. In 1982, Terry Erwin used a “kill ‘em and count ‘em” method to estimate insect diversity in a tropical forest. As shown in the video, the
current method is to use field measurements combined with mathematical models; this is the technique used in this activity.
Outline
Exercise 1: Practice calculating diversity with diversity indices.
Exercise 2: Testing the effect of habitat fragmentation on biodiversity.
** Be sure to complete all calculations, show work, and answer all questions on the lab worksheet!! **
Exercise 1: Practice calculating diversity with diversity indices.
Background: Imagine a section of marsh that contains 43 species of plants. In terms of numbers of species, it is more diverse than a neighboring section that contains only 26 species.
Suppose, however, that in the section with 26 species, the species were all roughly comparable in numbers of individuals; and in the section with 43 species, a few species were prevalent and the rest were rare.
Which section would then be most diverse?
Which section would then be most diverse?
Ecologists have used various indices as a means to quantify biodiversity. One simple index is the Simpson Index.
To calculate this Simpson Index, we need to know the number of individuals for each particular species (n) and the sum of those numbers (N):
D = SUM (n/N)2
For example, in a community of three species where one species has 6 members, a second has 12, and a third has 42:
D = (6/60)2 + (12/60)2 + (42/60)2 = 0.54
So when we are calculating D, we are summing the squares of the proportion each species makes to the total.
D actually is inversely related to diversity. When D = 0 (its theoretical minimum), there is infinite diversity.
When D = 1 (its maximum), there is no diversity as all of the individuals are from just one species.
Ecologists will often use the reciprocal of D, 1/D. This figure actually has meaning in that it is the effective
number of species in the area.
In the case above, the effective number of species is 1/0.54 or 1.852.
Although there are 3 species in this area (because 1 species is common and the other 2 are relatively rare) there is less diversity than there would be if there were 2 equally frequent species.
2 equally numerous species would have a D of 0.5 and 1/D of 2.
The maximum number of effective species is equal to the actual number of species and is achieved only when all species are equally abundant.
Exercise #1 - Activity:
Work individually to answer the following questions:
Calculate D and then the effective number of species in a community (1/D) that consists of the following:
Species A – 35
Species B – 26
Species C – 13
Species D – 6
Species E – 4
How does D for this scenario compare to the numbers worked out in the example?
How does this population compare to the example population with three species where one dominates (i.e., is it more
diverse, less diverse, or about the same)?
Calculate D and then the effective number of species in a community (1/D) that consists of the following: Species A – 35
Species B – 26
Species C – 13
Species D – 6
Species E – 4
How does D for this scenario compare to the numbers worked out in the example?
How does this population compare to the example population with three species where one dominates (i.e., is it more diverse, less diverse, or about the same)?
Exercise 2: Testing the effect of habitat fragmentation on biodiversity.
Background: Habitat loss and fragmentation are considered by many to be the leading threat to biodiversity around the world. When people alter natural areas, for example, through agriculture or urban sprawl, the habitats needed to sustain native species are often eliminated. The remaining natural areas
are left isolated. This process is referred to as habitat fragmentation. This problem is one of the major concerns of conservation biologists.
In this exercise, you will compare the diversity of spiders to test the effect of habitat fragmentation on biodiversity.
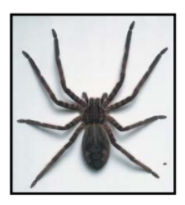
Spiders are a highly species rich group of invertebrates that exploit a wide variety of niches in virtually all the earth’s biomes. Some species of spiders build elaborate webs that passively trap their prey whereas others are active predators that ambush or pursue their prey.
Spiders represent useful indicators of environmental change and community level diversity because they are taxonomically
diverse, with species inhabiting a variety of ecological niches, and they are easy to catch.
These spiders were captured by a biologist traveling along transects through the patches and striking a random series of 100 tree branches. All spiders dislodged that fell onto an outstretched sheet were collected and preserved in alcohol.
They have since been spread out on a tray for you to examine.
2 forest patches were sampled. Forest patch “1” is a large undisturbed patch of mature forest covering an area of approximately 5 square miles and is protected as part of a state park complex.
Forest patch “2” is located in the center of a subdivision. This patch is only 0.75 square miles and is isolated from any other forested habitat by development.
Exercise 2 - Activity:
Your first task is for you to sort and identify the spiders. To do this you have to identify all the specimens in the collection. To classify the spiders look for external characters that all members of a particular group of spiders have in common but that are not shared by other groups of spiders. (For example, leg length, hairiness, relative size of body segments, or abdomen patterning and abdomen shape all might be useful characters.)
Assign each species a working name, preferably something descriptive. For example, you might call a particular species "spotted abdomen, very hairy" or "short legs, spiky abdomen." Just remember that the more useful names will be those that signify to you something unique about the species.
Construct a table for each forest patch listing each species and the number of occurrences of the species in the collection.
Use the data in this table to calculate 1/D for forest patch 1 and forest patch 2.
Attach data table and calculations page to lab before submitting.
Create or paste in your data table in the "show your work" box.

What is the diversity index for each forest patch?
Which forest patch is more diverse?
How might the impacts on the forest patches differ between the two sites?
How might this lead to the
differences in diversity you have observed?