7.3.1
star
star
star
star
star
Posljednje ažuriranje about 2 years ago
8
1
1
1
1. Estimate the side length of a square that has a 9 cm long diagonal.
2. Select ALL quantities that are proportional to the diagonal length of a square.
3. Diego made a graph of two quantities that he measured and said, "The points all lie on a line except one, which is a little bit above the line. This means that the quantities can't be proportional." Do you agree with Diego?
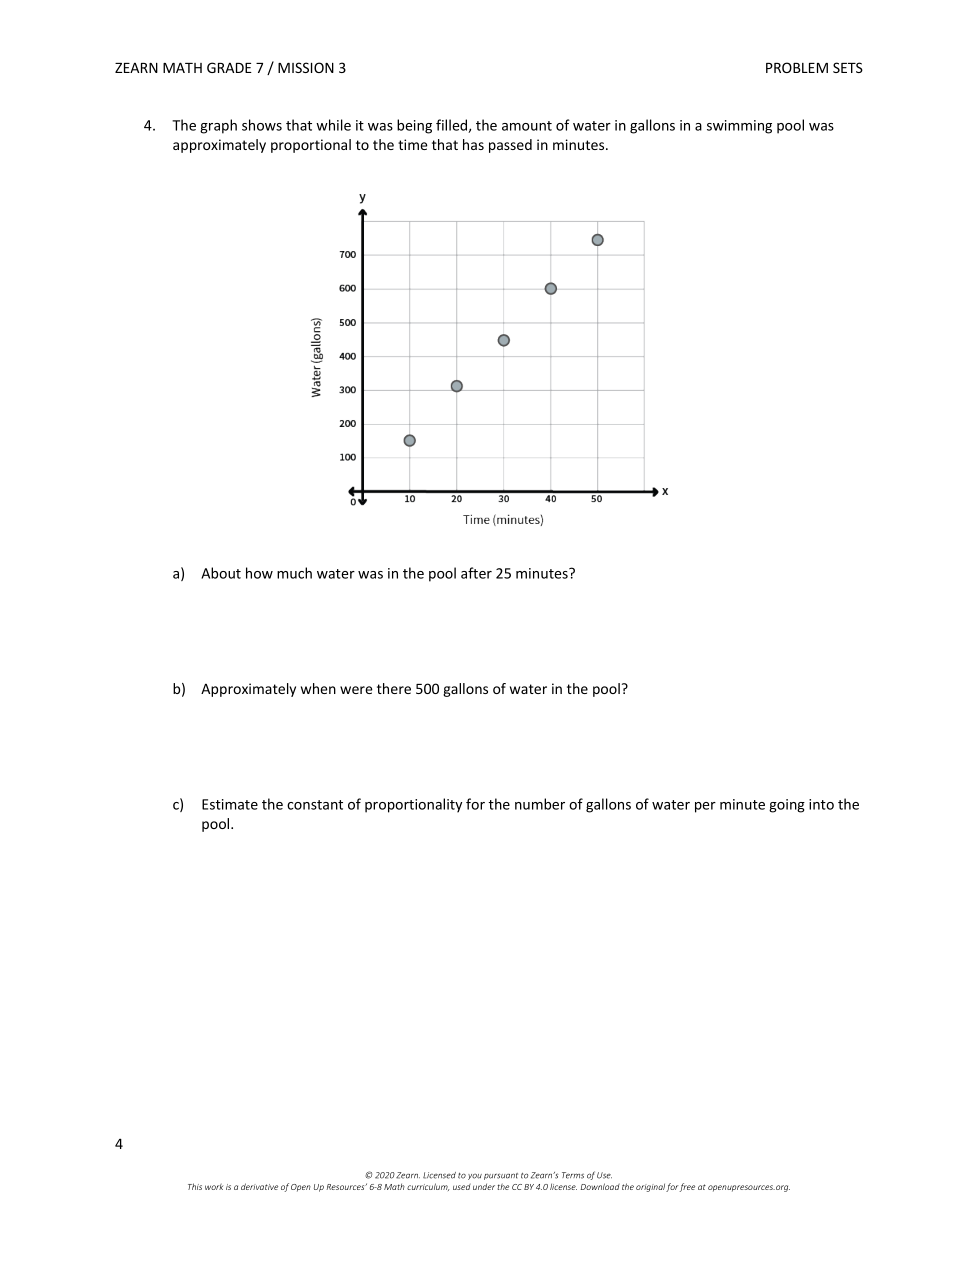
4. The graph shows that while it was being filled, the amount of water in gallons in a swimming pool was approximately proportional to the time that has passed in minutes.
a) About how much water was in the pool after 25 minutes?
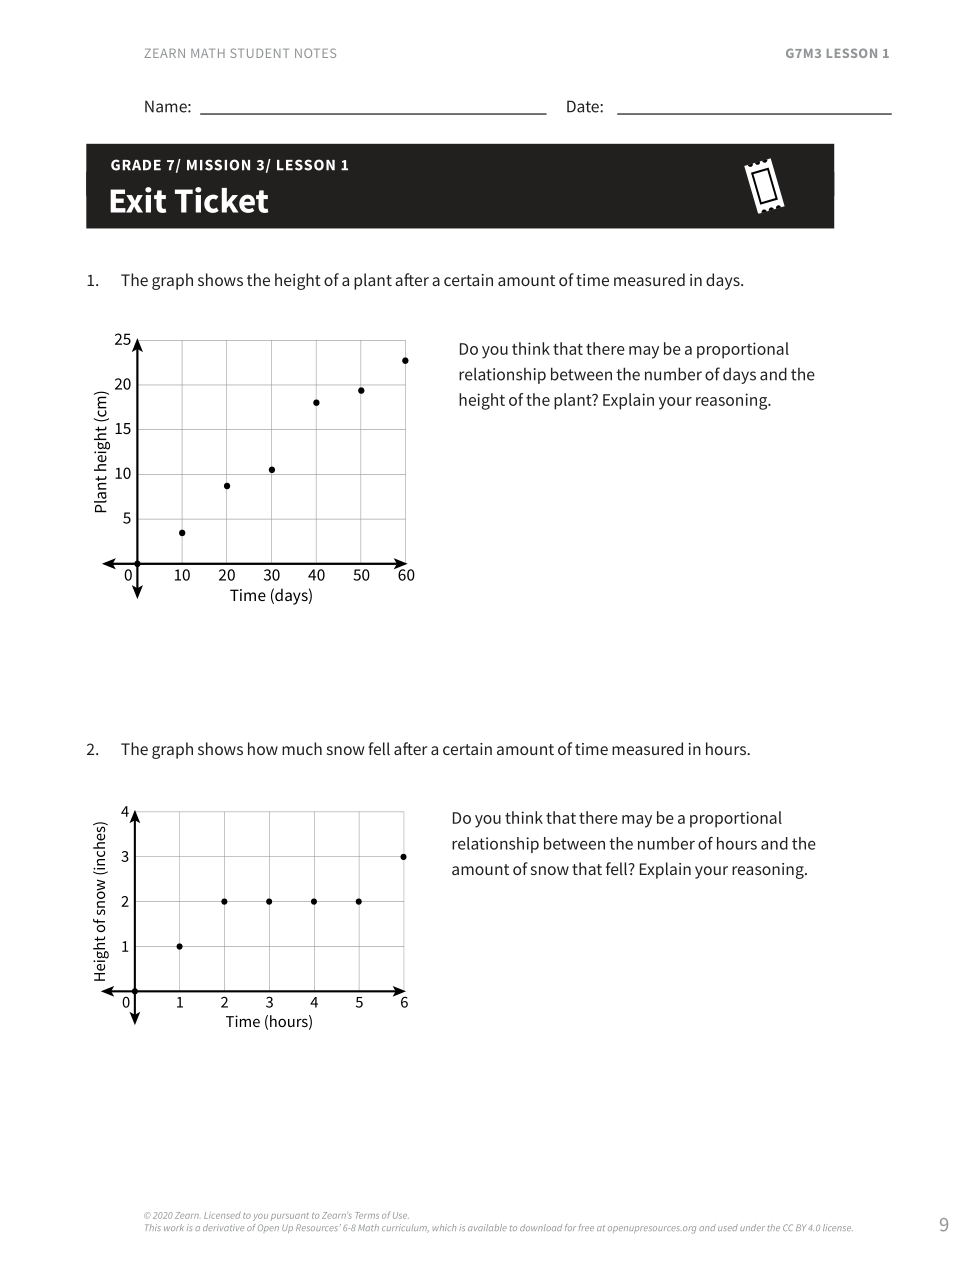
Exit Ticket
1. The first graph shows the height of a plant after a certain amount of time measured in days.
Do you think that there may be a proportional relationship between the number of days and the height of the plant?
Exit Ticket
2. The second graph shows how much snow fell after a certain amount of time measured in hours.
Do you think that there may be a proportional relationship between the number of hours and the amount of snow that fell?
4b. Approximately when were there 500 gallons of water in the pool?
4c. Estimate the constant of proportionality for the number of gallons of water per minute going into the pool.